
How close is Bitcoin’s price to its bottom? Analysts’ answer
Investment management firm ARK Investment Management released a report on Bitcoin price dynamics, in which analysts noted a “neutral and slightly positive” outlook for the cryptocurrency in the near future. According to them, BTC is nearing its bottom in this bearish cycle, so investors can expect a reversal on the digital asset’s chart soon. In the meantime, experts expect to see a few more clear signs of “capitulation” – the final wave of collapse before the price low. We tell you more about the situation.
It should be noted that the cryptocurrency industry is now witnessing a trend of bitcoins being withdrawn from centralised exchanges. According to analysts at Glassnode, the balance of trading platforms has dropped to 2.4 million coins – which is the level of July 2018. The figure peaked at the 3.15 million bitcoin line in the first half of 2020.
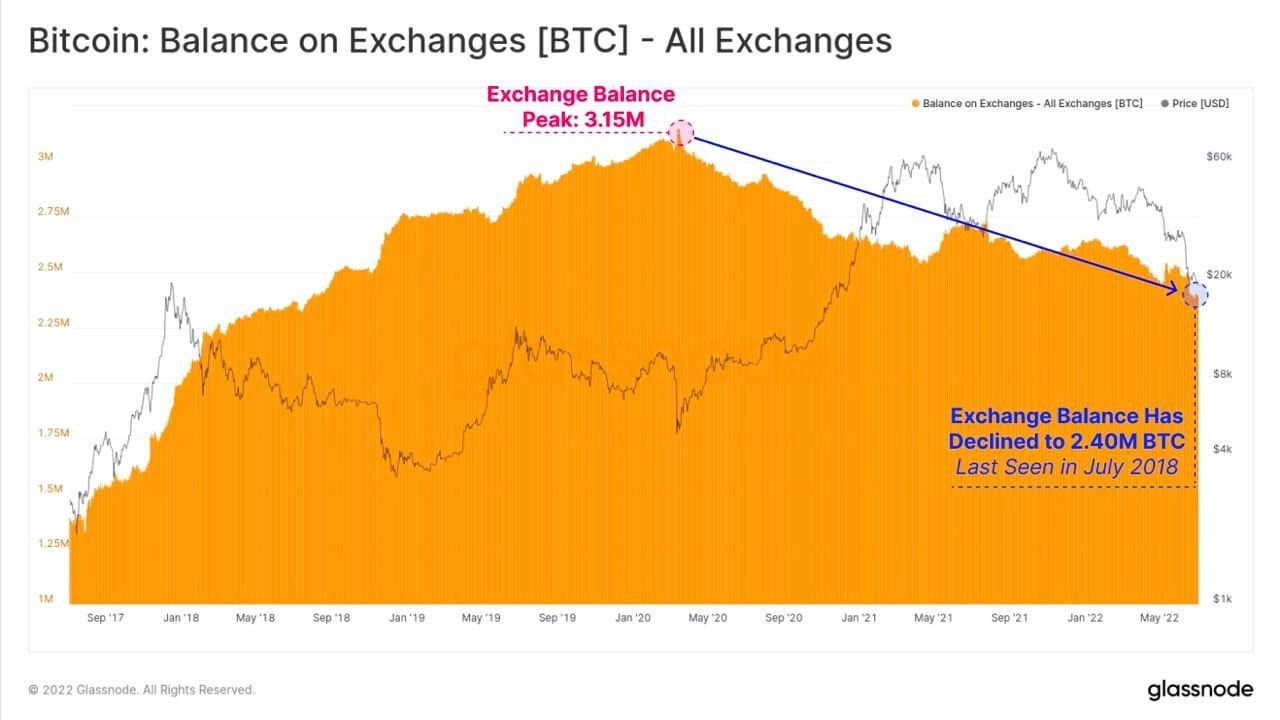
Bitcoin cryptocurrency exchanges balance chart
The withdrawal of coins – one way or another means less pressure from sellers, as those wanting to get rid of cryptocurrency usually wind up on an exchange rather than the other way around. Against this backdrop, analysts are speculating on whether Bitcoin has much longer to fall in value.
What’s going on with Bitcoin?
Here’s one of the quotes from the report shared by experts.
After almost 70 per cent fall from its all-time high, Bitcoin is trading below some of its most important levels: The 200-day moving average line, the realised price, price expectations of short- and long-term holders, and the 2017 bullrun high.
It is worth noting that Bitcoin is balancing at $20,100 this afternoon – just above the peak of the previous bullrun. That said, experts conducted a niche study at a time when Bitcoin was trading in the $19,500 zone, which is indeed below the peak of the rate from December 2017.
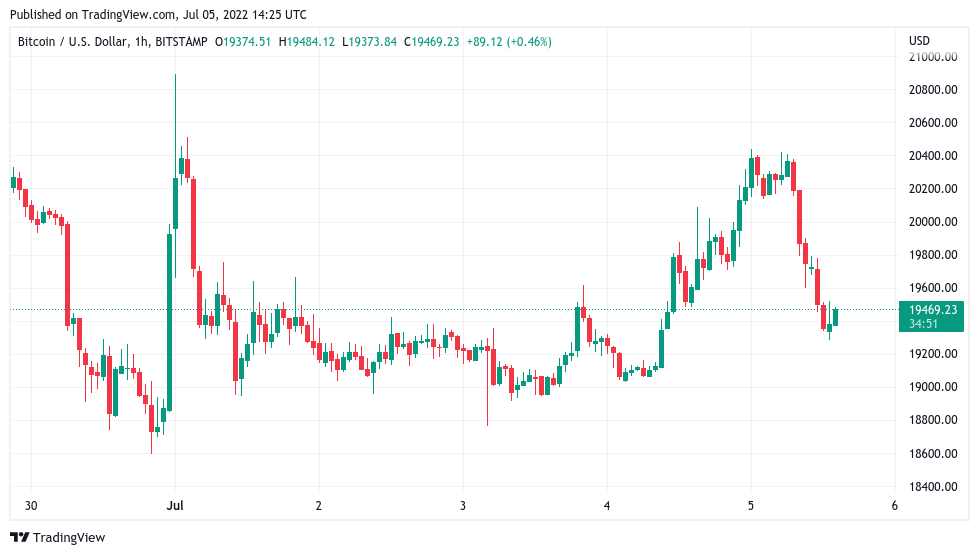
Bitcoin exchange rate
According to Cointelegraph sources, the aforementioned signs can be interpreted as capitulation, that is, the last stage of coin dumping by those investors who do not have enough faith in the crypto and are influenced by emotions. The reason for selling is the fear of further market collapse and the desire to save the remaining money, even if at a loss.
Analysts continue.
The activity at the aforementioned levels is atypical and suggests that the asset is severely oversold. Only four times in its history has Bitcoin traded so low against these lines.
In other words, experts confirm that BTC and other coins are trading quite cheaply today. Accordingly, the crypto-asset is oversold or over-sold.
However, the possibility of a new wave of BTC sinking is not ruled out: it can be fixed by the so-called MVRV indicator, which is the ratio of realized asset capitalization to the price basis of coins held by market players for different periods of time. Experts explain this point.
Historically, a global bottom of the Bitcoin cycle is formed when the MVRV performance of short-term BTC holders exceeds the same metric for long-term holders. As long as this condition is not met, it means there is potential for further Bitcoin price declines.
As a reminder, instead of using the market price multiplied by the number of coins in circulation, realised capitalisation approximates the value of all existing coins by summing the market value of the coins at the time they last moved across the blockchain. MVRV is simply a ratio comparing the two types of capitalisation. Accordingly, it can be calculated for different types of market players, represented by short-term and long-term holders, by selecting when coins move across the blockchain.
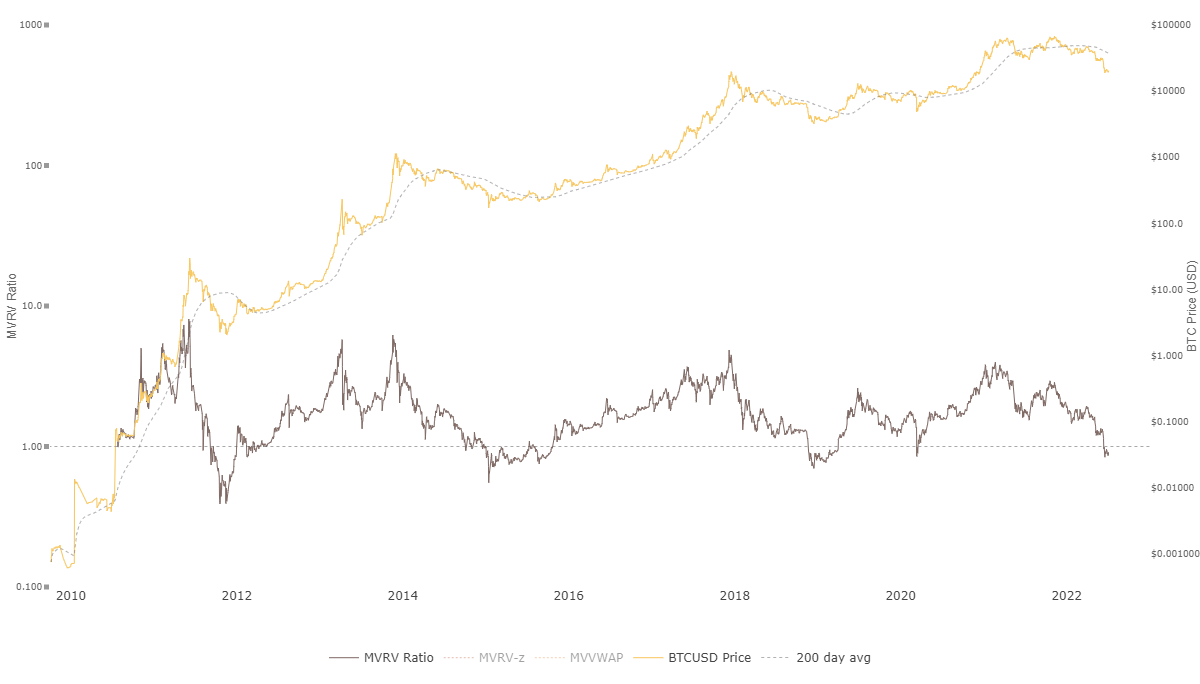
The value of MVRV for Bitcoin
The opinion of some well-known representatives of the cryptocurrency industry is to a certain extent in line with the ARK analysts’ report. Here, for example, is a tweet by an investor under the nickname il Capo Of Crypto.
Bitcoin continues to make descending local highs. The rising episodes have low trading volumes and don’t look very impressive. The main target remains the same – the level between $15,800 and $16,200.
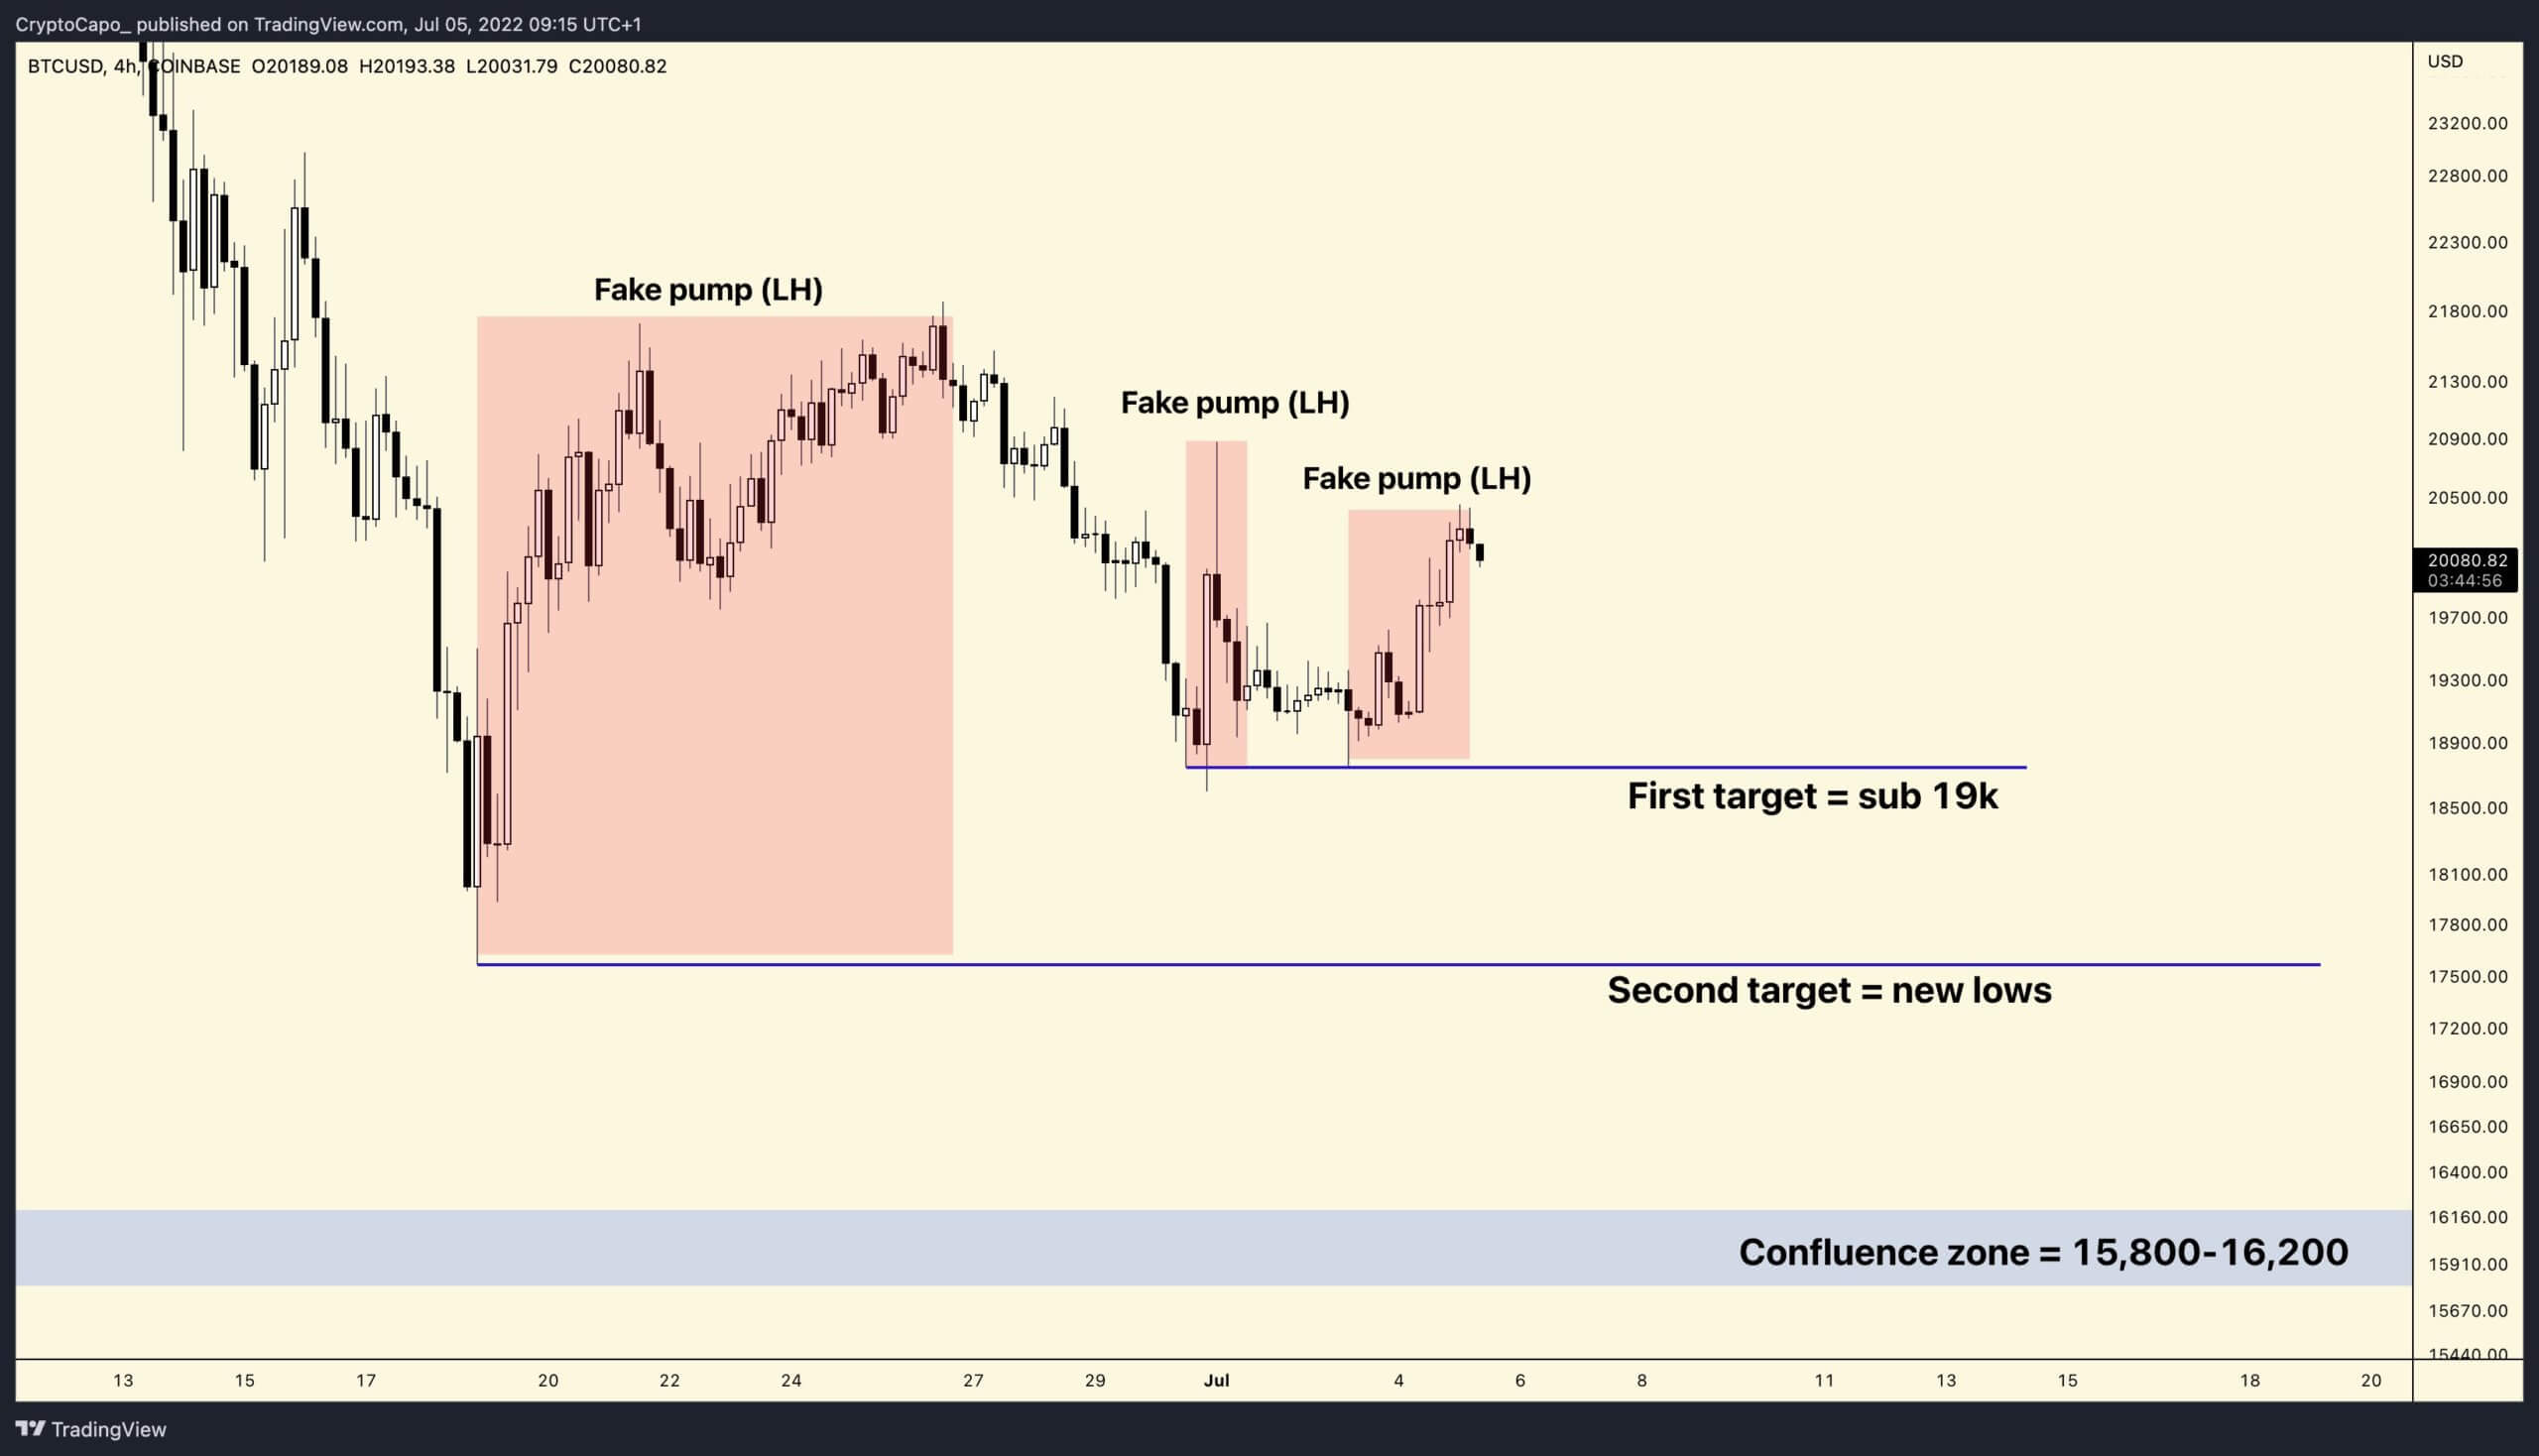
Targets for Bitcoin from a crypto-enthusiast
Another trader under the nickname Rekt Capital has outlined the zone limits for BTC accumulation that he has chosen for himself.
Historically, the 200-week moving average was the bottom in previous cycles for BTC. Things are a little different now. Instead of forming a bottom at the 200MA, the cryptocurrency could fall into a channel below that line. Anything that can be bought below 200MA is likely to be the best opportunity to enter the market.
In the end, an investor thinks that buying the cryptocurrency at current or slightly lower levels is not a bad opportunity. However, this is not a financial recommendation, so invest only according to your own market analysis.
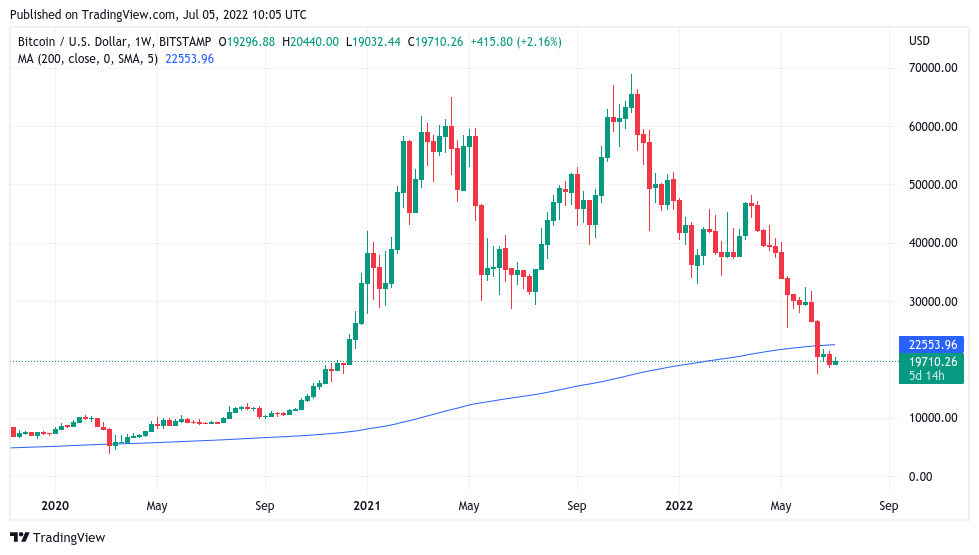
Moving average on the 1-week chart of Bitcoin
Perhaps some of the market players have already realized the details of what is happening and are slowly starting to buy the coins more actively. At least the panic among traders has subsided a bit – the Fear and Greed Index from Alternative has risen to its two-month high. At the time of writing, it stands at 18 points out of 100.
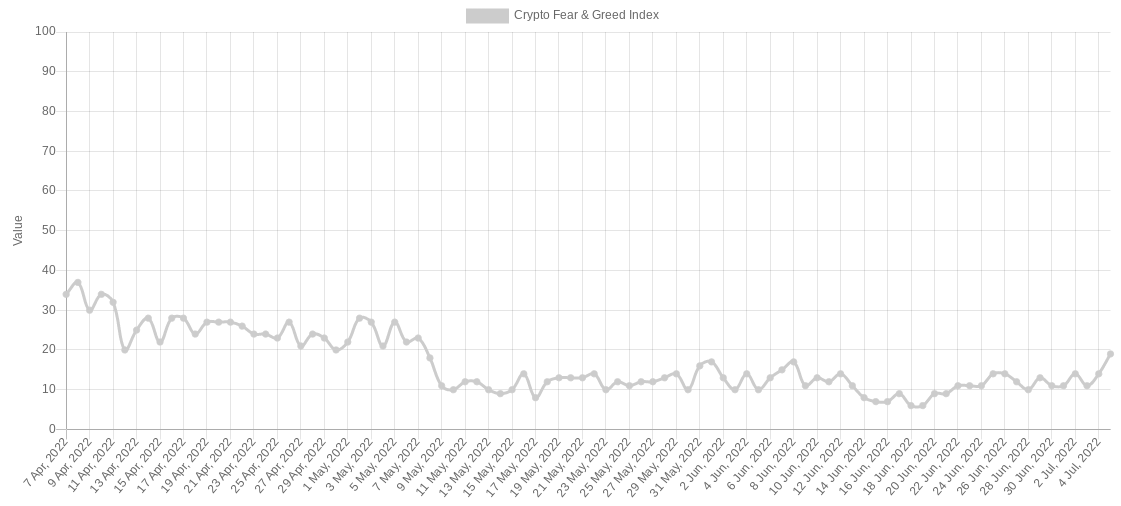
Fear and Greed Index
We believe that predicting the exact bottom of Bitcoin is impossible, even with an abundance of analytical data. However, it is important to keep in mind that today the BTC exchange rate is 70 percent behind its record high. Of course, the asset may continue to decline, but this figure is enough for decentralization lovers, who have been convinced of the crypto's long-term potential. The rest of us have yet to do so.
What do you think about it? Share your opinion in our Millionaire Crypto Chat. There we discuss other important developments in the blockchain world.
Related posts