
Bitcoin is down to $24,000. What will this week be like for the crypto market?
The price of Bitcoin rose markedly last week, with it reaching its highest level in recent months. Many other cryptocurrencies have seen positive bullish developments on the charts. This is especially true for Etherium, with the altcoin up tens of percent on investor expectations for the upcoming move to Proof-of-Stake. Overall, there could be some interesting developments this week. We tell you more about what’s going on.
This morning, the cryptocurrency market remains relatively stable. At least over the last 24 hours, the exchange rates of popular coins have remained almost unchanged. Here are the changes in the value of digital assets over the last day.
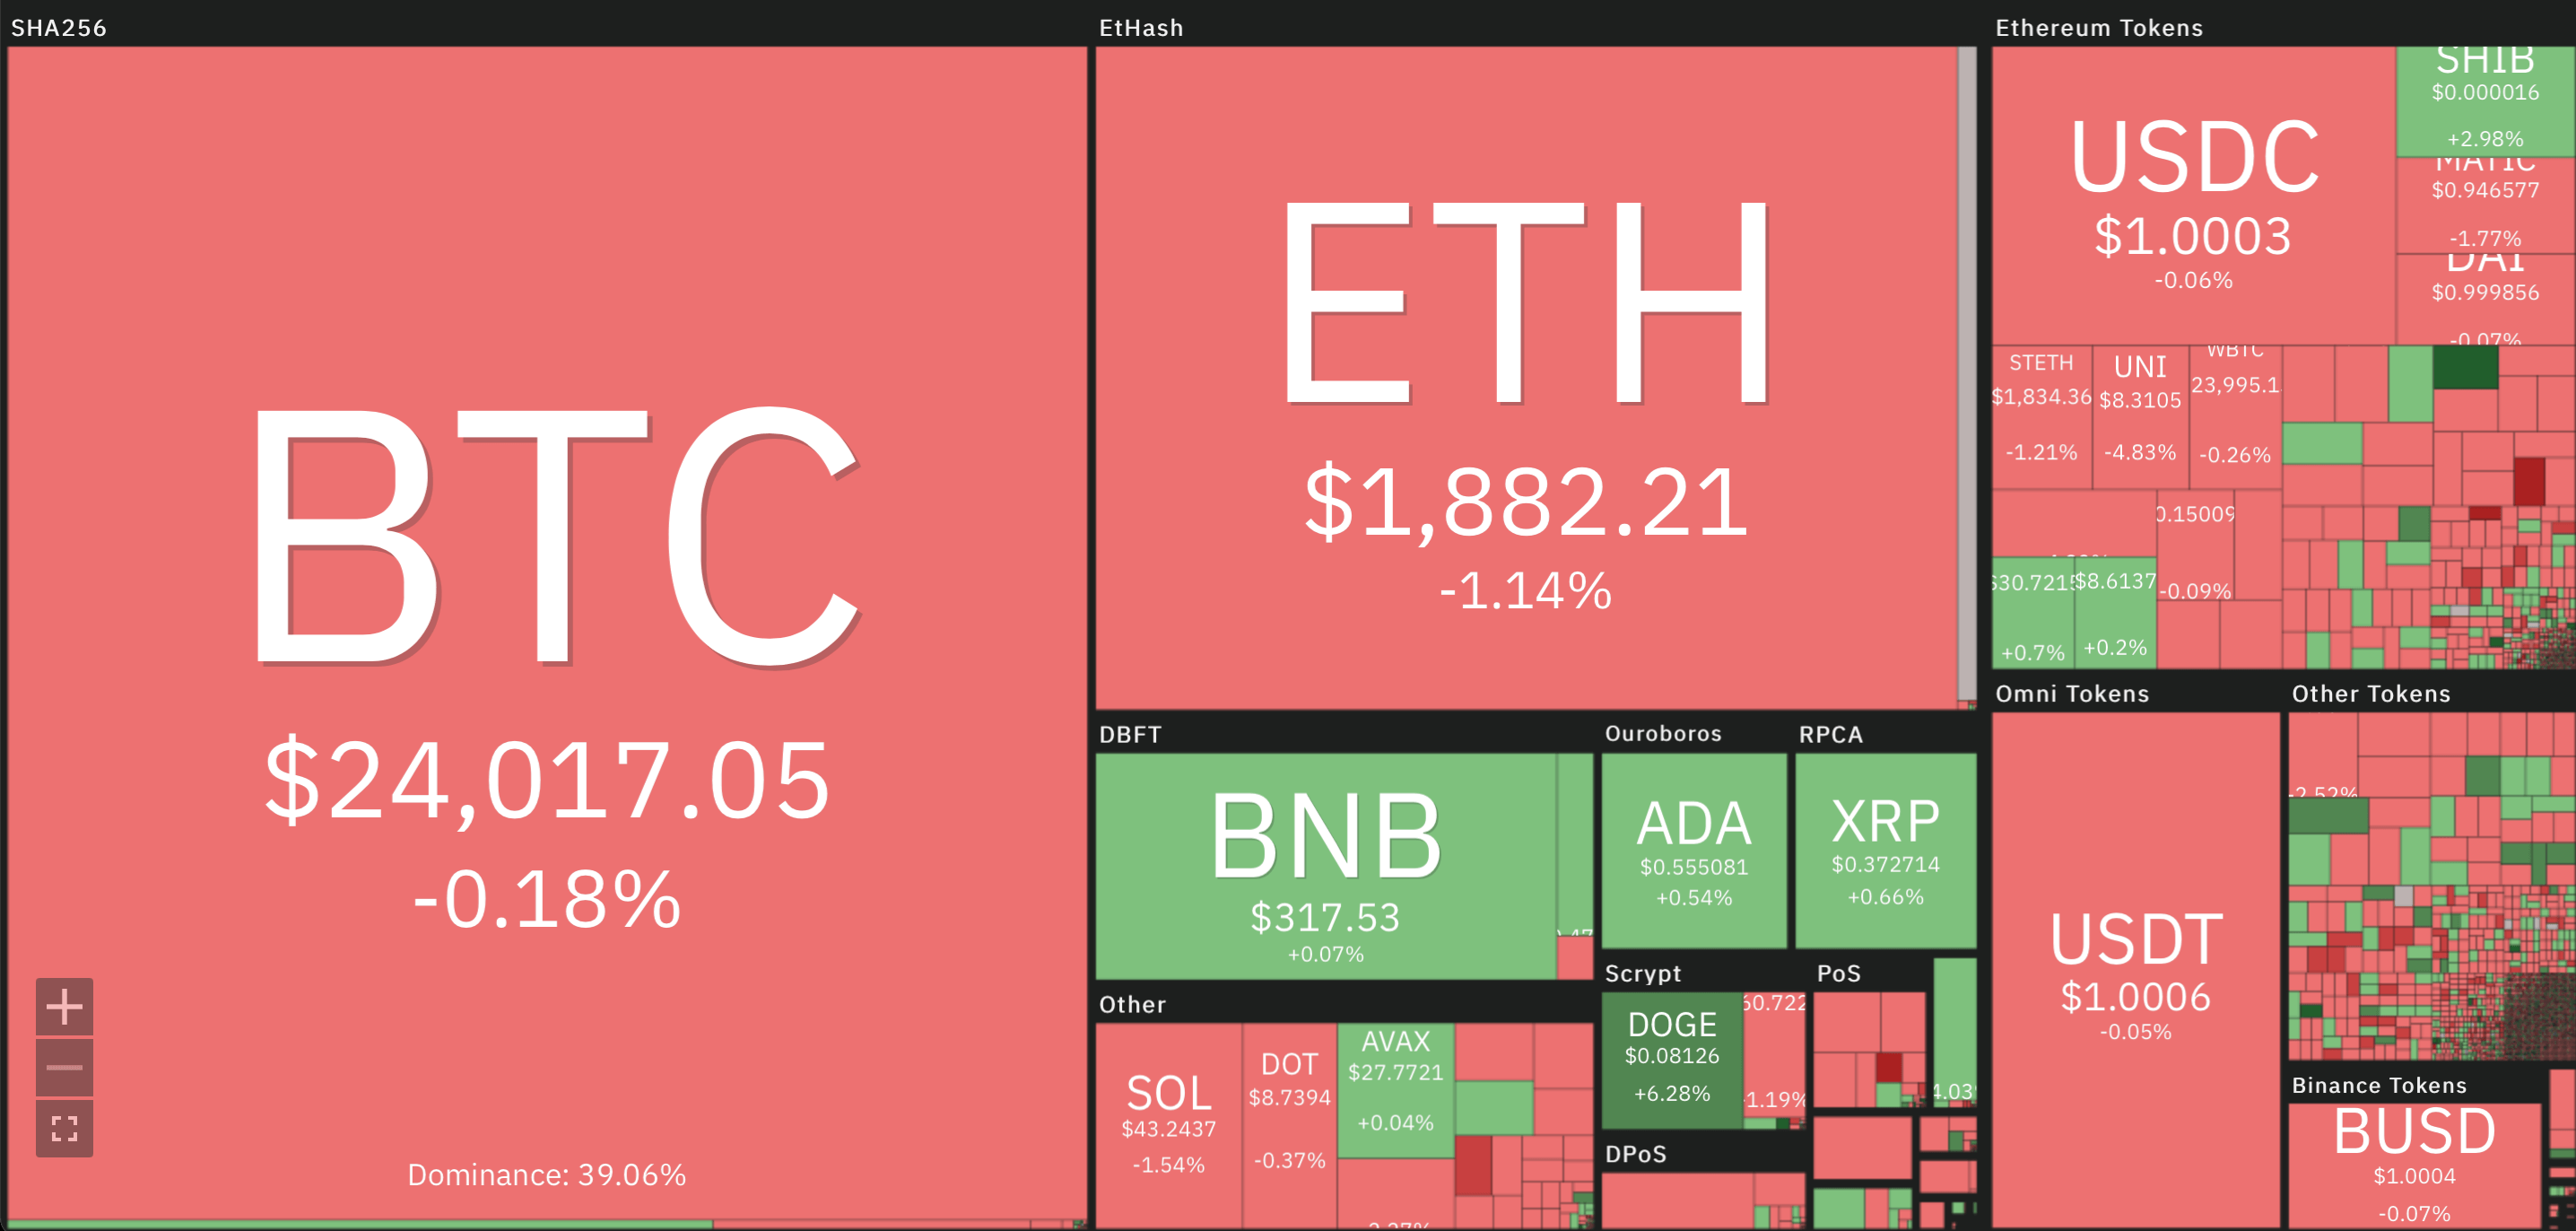
Changes in cryptocurrency rates over the past 24 hours
What’s next for Bitcoin
On the scale of Bitcoin’s 1-week chart, the previous candle closed at $24,300, while the cryptocurrency reached the $25,200 line at the weekend.
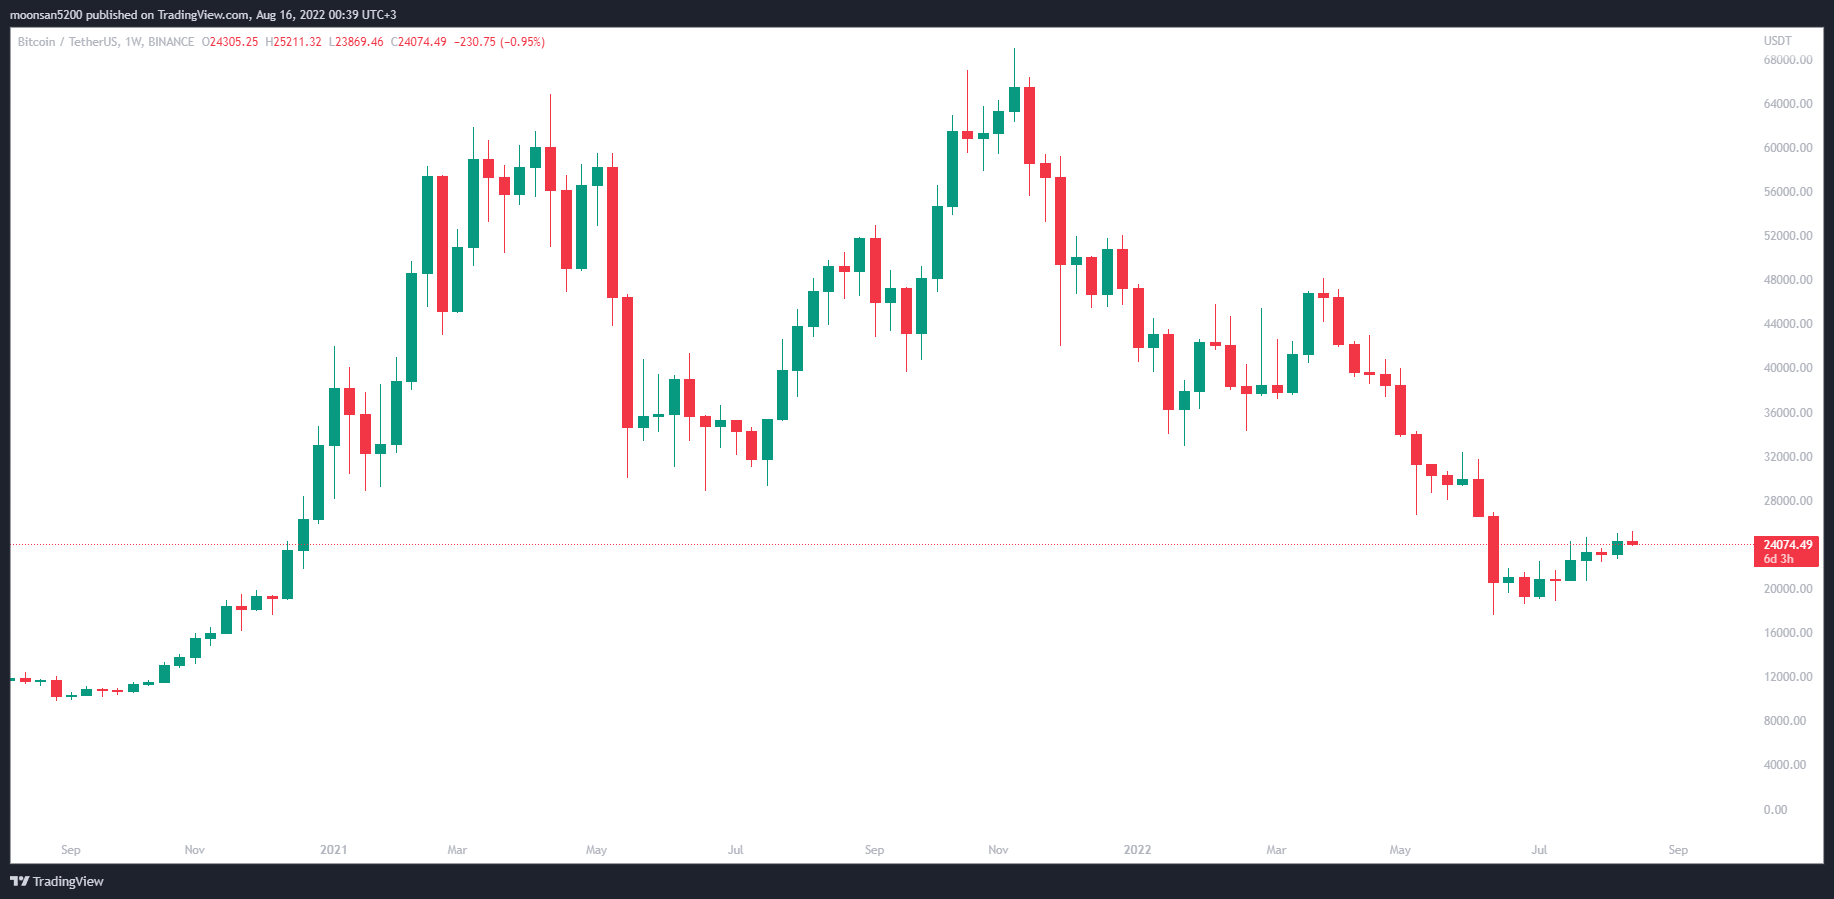
Bitcoin 1-week chart
For now, Bitcoin continues to fall locally, as a popular crypto trader under the nickname Crypto Tony stated on his Twitter the day before. Here’s his rejoinder.
A new week has begun, with the bears taking the initiative to test some key support levels. Again, in terms of market dynamics this will be an interesting week. Crypto is slightly overbought on a small chart scale.
Overbought in the context of cryptocurrencies means too high for current conditions. The opposite condition here is the so-called oversold, which was the case for coins in mid-June 2022.
Peter Schiff, a well-known Bitcoin heater and gold fan, also shared his prediction. He expects BTC to collapse to at least $10,000, and has been doing so for a long time.
To put the recent Bitcoin rally in global perspective, take a look at this chart. The pattern remains very bearish. There is both a double top and a head and shoulders top. An upward wedge is forming below the neckline. At a minimum, support will be tested below $10,000.
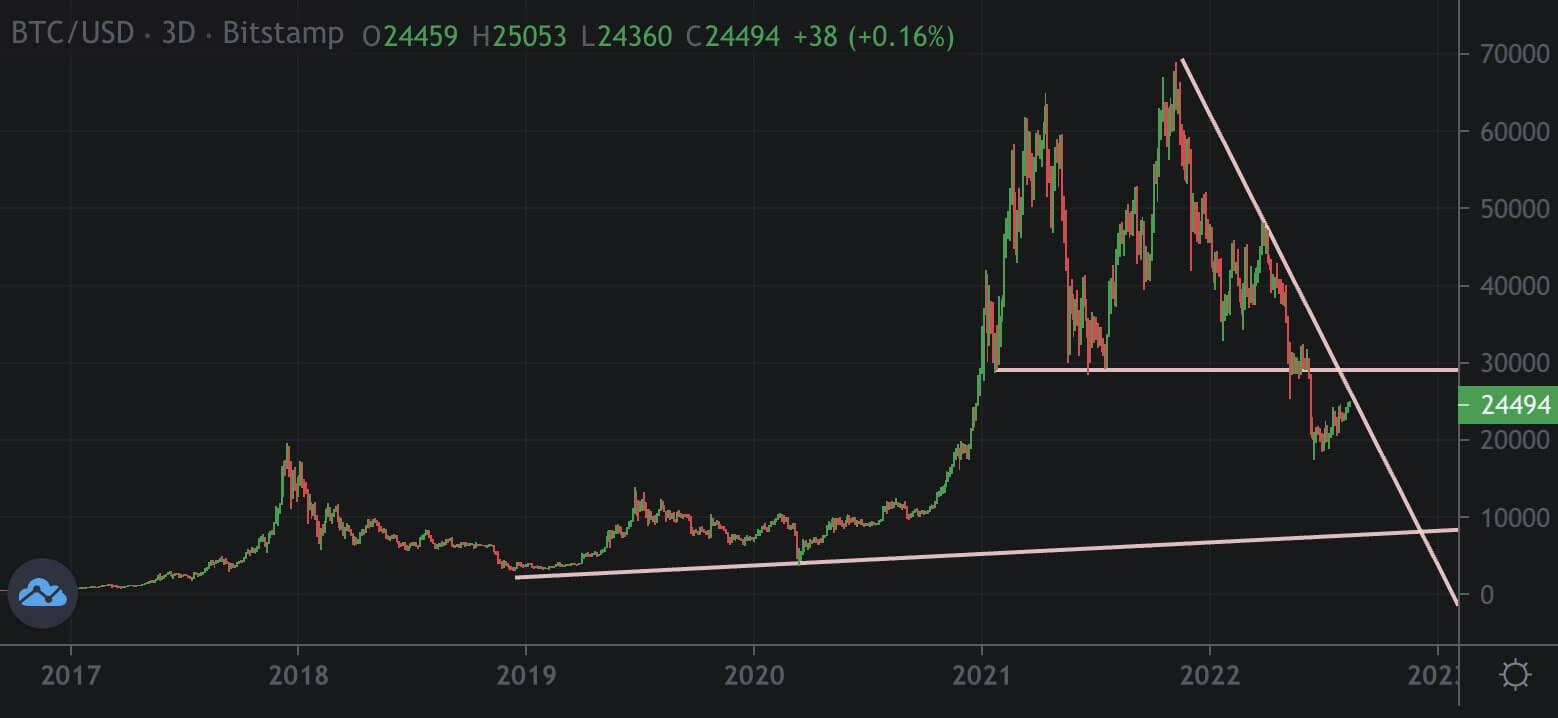
Chart published by Peter Schiff
Yes, this is another “scare” statement from Schiff, but if you remember his previous statements about Bitcoin, it’s hard to believe him. This analyst has been predicting a complete collapse of the crypto market for several years in a row, while Bitcoin has only been making new all-time highs. Accordingly, one should not believe absolutely every “expert” on Twitter, even if he has many followers.
As proof, let’s recall the same Schiff’s tweet from August 2019. At that time, he said that Bitcoin will definitely never be worth $50,000, but gold will rise to $5,000 sooner or later. So in this case he was wrong, and he did it twice within one tweet. As you know, the maximum of BTC rate from November 2021 is $69 000.
From the guy who had a $50,000 price target on Bitcoin for year-end 2018. My gold forecast came a lot closer than your Bitcoin forecast. Plus at least gold will eventually hit 5k. Bitcoin will never hit 50k.
– Peter Schiff (@PeterSchiff) August 21, 2019
What is the situation in the macro economy?
According to Cointelegraph sources, all is calm in traditional markets so far. The day before, the official US consumer inflation figures were announced. It was 0.2 percent lower than expected, which was very positive for securities and crypto among others. The US Federal Reserve did not make any important announcements after raising the benchmark lending rate at the end of July.
But there is one interesting observation shared by a crypto-enthusiast under the nickname Filbfilb. He posted a chart comparing the price performance of the NASDAQ and S&P500 stock indices to the price of Bitcoin (in blue). It clearly shows the cryptocurrency’s lagging growth.
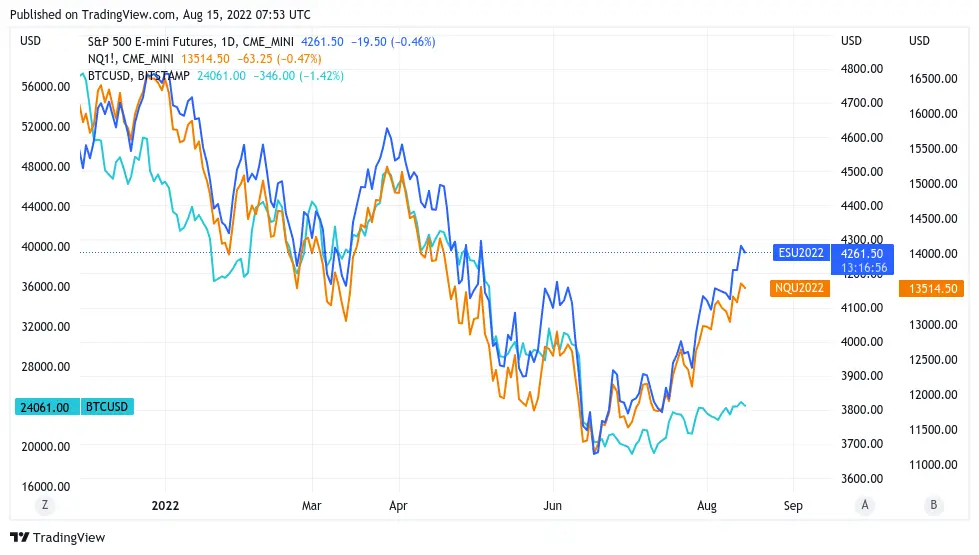
Bitcoin’s correlation with the S&P500 and NASDAQ stock indices
Here’s an expert quote on the subject.
Bitcoin has previously been highly correlated with traditional markets, as shown below. The S&P500 on the chart is marked with a blue line and the NASDAQ with an orange line. After falling to recent lows, traditional assets have started to rise quickly, but Bitcoin is lagging far behind in this trend.
Consequently, the growth rate of cryptocurrencies is still far from optimal in the current market conditions.
Filbfilb added that if Bitcoin’s correlation with the aforementioned stock indices had been at par with itself a few months earlier, BTC would have already risen to at least $30,000. So why is Bitcoin now a laggard? Filbfilb sees the reason as the collapse of the Terra project, as well as the collapse of the Three Arrows Capital fund and the Celsius platform. All of these events together created a “perfect storm” that led to a significant decline in BTC’s correlation with stock indices. This is why digital assets have so far shown restraint in their development.
That said, Look Into Bitcoin founder Philip Swift expects that Bitcoin’s near-term rise could well happen given the funding rate data in cryptocurrency trading. Here’s his cue.
Interestingly, every time after local waves of BTC growth, the funding rate has taken a negative value. Notice that the Bitcoin price only went up after each such event.
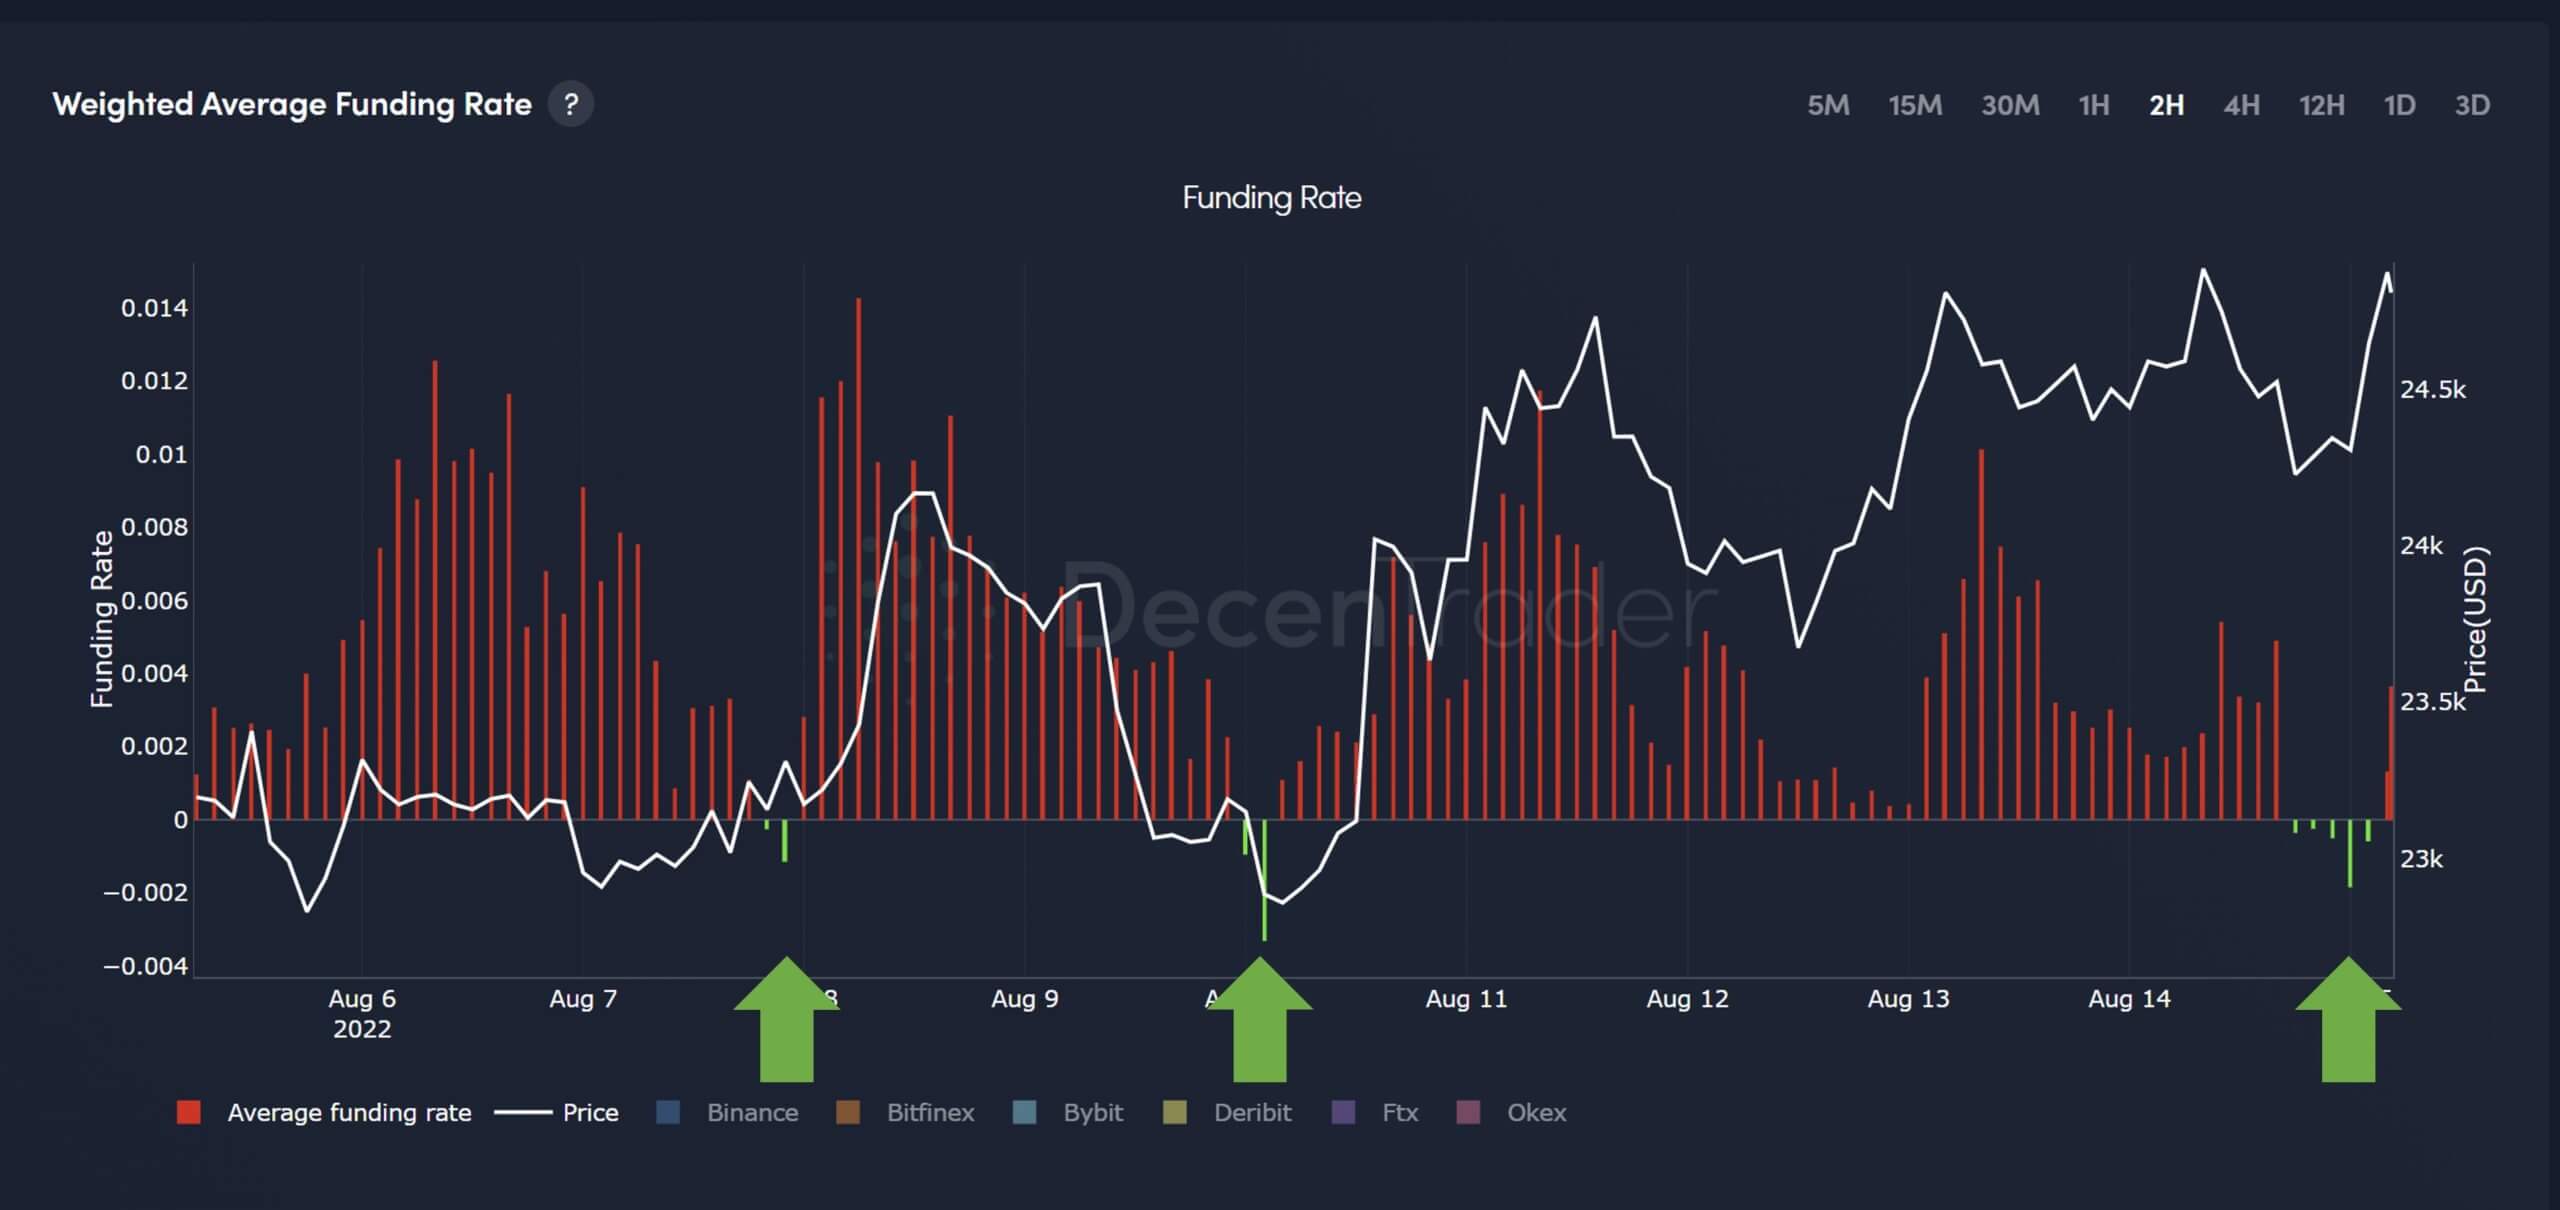
Funding rate dynamics and Bitcoin price
As a reminder, the funding rate is a periodic payment to long or short traders based on the difference between the spot market and the open-ended futures market. Depending on the open position, the trader either pays or receives funding. The financing rates on the various exchanges are recalculated several times a day. If the rate is negative, the holders of short positions pay the holders of long positions. And vice versa.
A negative rate also indicates a large volume of simultaneously open short positions, i.e. on the sale of an asset. According to Swift, under such conditions, when a particularly large volume of long positions are opened, i.e. buying the asset, the cryptocurrency price rises quickly, forcing short traders to buy back BTC to close the position. Because of this, the rise of the coin only accelerates.

Cryptocurrencies
We believe that the market has remained relatively stable so far. Although Bitcoin reached the $25,000 level for the first time in a long time, the cryptocurrency as a whole continues to be in a relatively narrow price channel. At the same time, investors are still accumulating digital assets. This means that the same level of $17,000 for BTC in mid-June may remain a local price bottom. But time will give all the answers.
Do you have your own forecast? Share it in our millionaires’ cryptochat. There we will discuss other important news from the world of blockchain and decentralization.
Related posts