
Cryptocurrency analysts reveal why Bitcoin may already be forming a price bottom
Typically, several technical and fundamental analysis metrics need to be used at once to determine the global bottom of Bitcoin. However, two indicators – realised price and the so-called MVRV ratio – are popular among many analysts. Judging by their readings, the global support level for BTC right now is formed around $20,000. Let us tell you more about what is going on.
To understand the context, let's walk through the indicator definitions. Realised price shows the average value of the BTC supply on the day of the last transaction of each coin in the blockchain. MVRV is the ratio between market and realised capitalisation of Bitcoin.
This ratio is an indicator of whether the current BTC price is above or below "fair value" and is also used to evaluate the market's profitability. Every time a coin's price is below its realized price, the MVRV coefficient falls below 1. This shows that investors are holding coins below their investment cost and incurring unrealized losses.

Cryptocurrency investor
A bottom, as you might guess from the name, is the local low of a particular asset’s exchange rate during a particular cycle. For example, after Bitcoin reached a peak of $20,000 in December 2017, the coin market went into a bearish cycle. The bottom for BTC then was $3,000, which was reached about a year later.
When to buy Bitcoin
Today Bitcoin almost reached the cherished level of $20,000. The market is now teetering on a fine line, with only Etherium showing strong growth over the past 24 hours amid an upcoming upgrade to Proof-of-Stake, as well as Solana SOL.
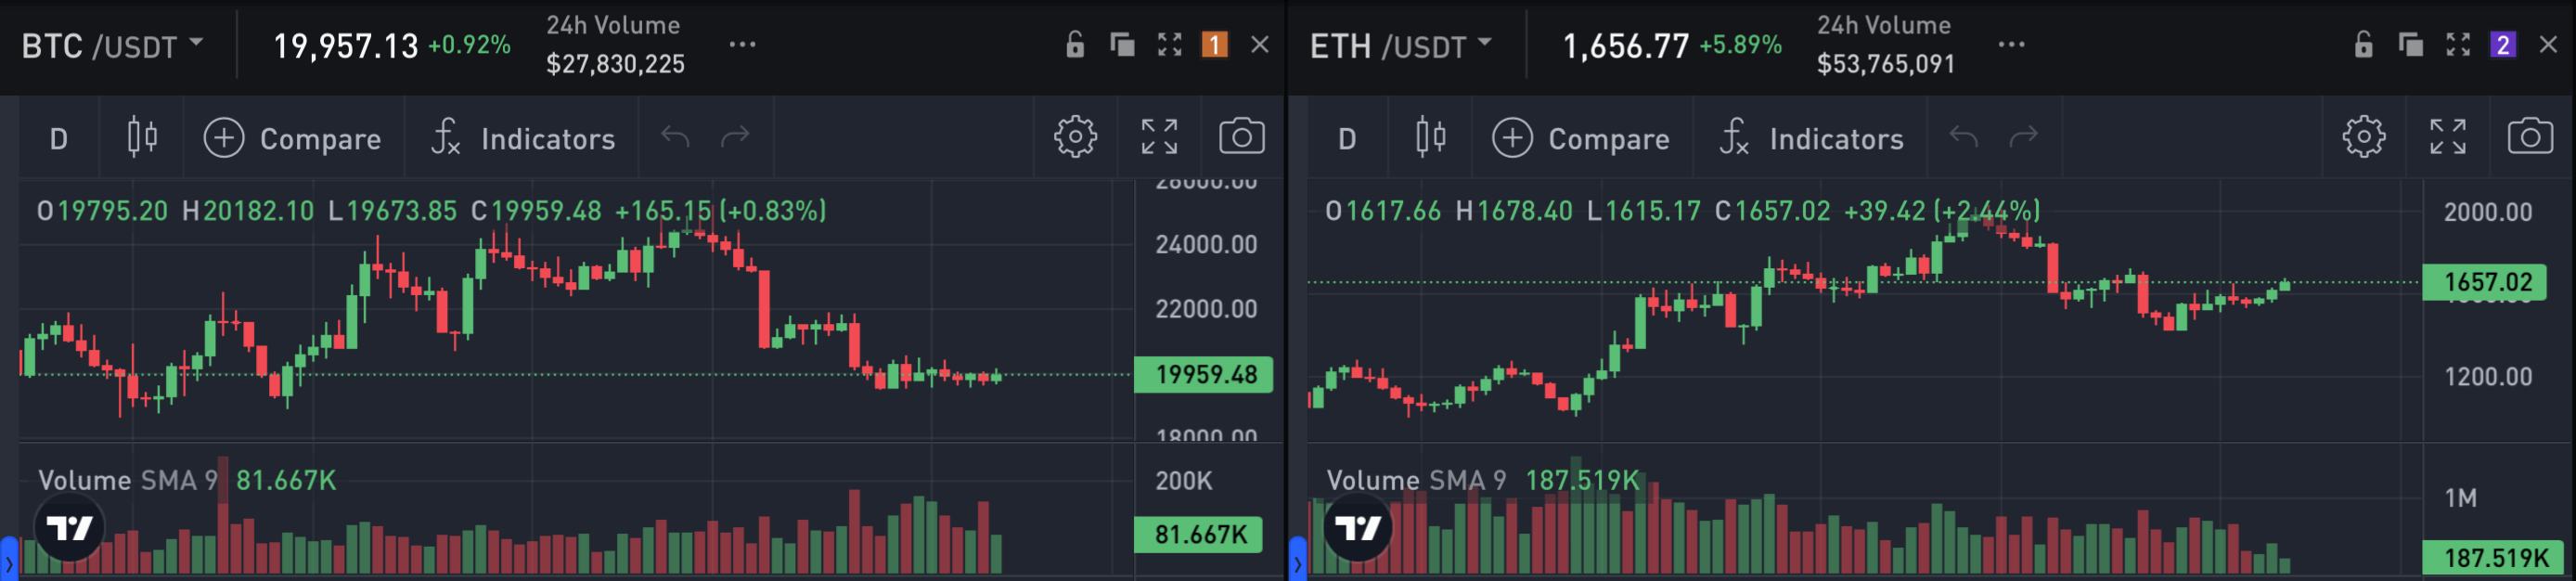
Daily charts of Bitcoin and Etherium exchange rates
The steady MVRV value over a notable stretch of time shows the formation of a potential support level. In all previous bearish cycles, the BTC price has fallen below the 200-week moving average realized price. Since 2011, the asset has spent an average of 180 days under this line. The only exception here was in March 2020, when this period lasted just a week.
Recall that the occasion for that collapse was the spread of the pandemic coronavirus. As this was the first time people were facing something like this, they were trivial in not knowing how to behave. As such, many took to selling off their own assets to get fiat money, which triggered the collapse.
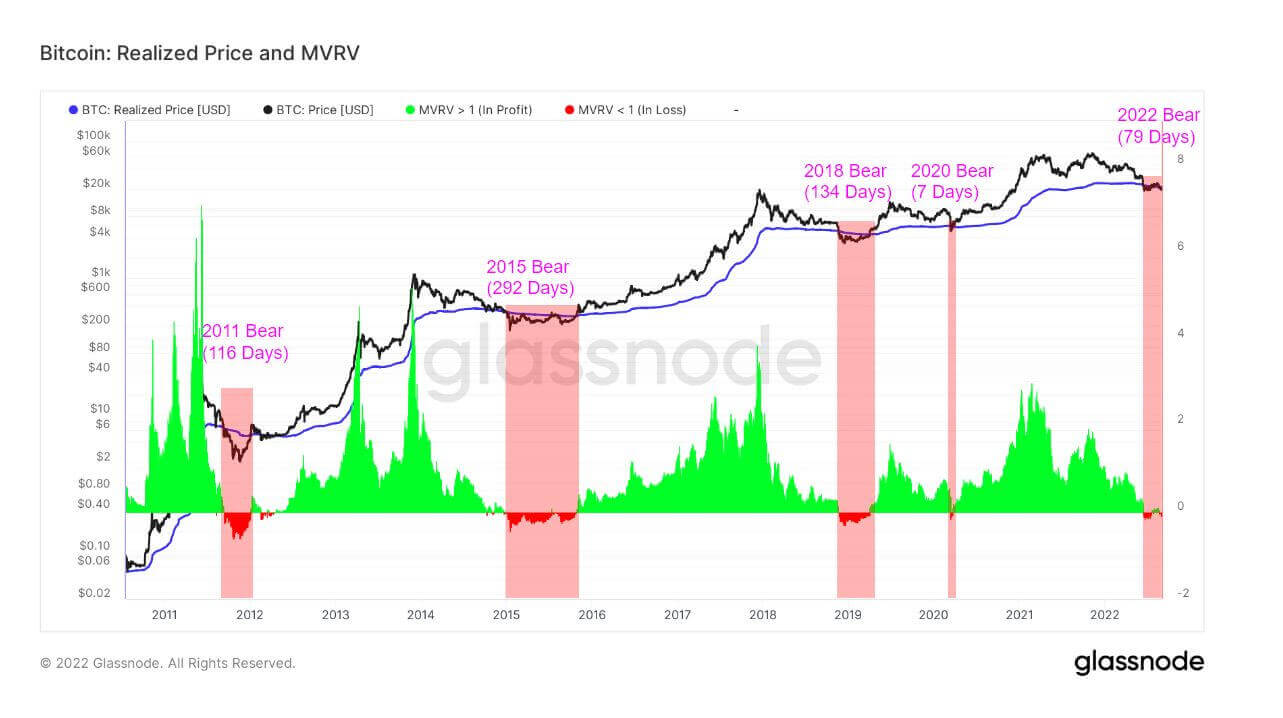
MVRV and Bitcoin price
CryptoSlate journalists consider the collapse of crypto project Terra as the start of the current bear cycle, based on data from analytics platform Glassnode. With that in mind, the period of time BTC has spent under the aforementioned moving average has already reached 80 days. Although the cryptocurrency saw a noticeable rebound to $25,000 on its chart in August, it’s too early to talk about the end of the bearish trend. But it gives an opportunity to consider levels around the $20,000 line as a good accumulation zone for BTC.
Earlier we wrote that most of the market players didn't lose their coins during the fall of BTC. Moreover, a significant number of investors remain optimistic about the cryptocurrency's future. This is a good sign for its potential growth.
It is worth noting that 12.58 million bitcoins have not moved for at least a year, equivalent to almost 66 per cent of all BTC in circulation. This is a record figure, which indicates that investors are reluctant to get rid of their own cryptocurrency and are willing to continue to accumulate it.
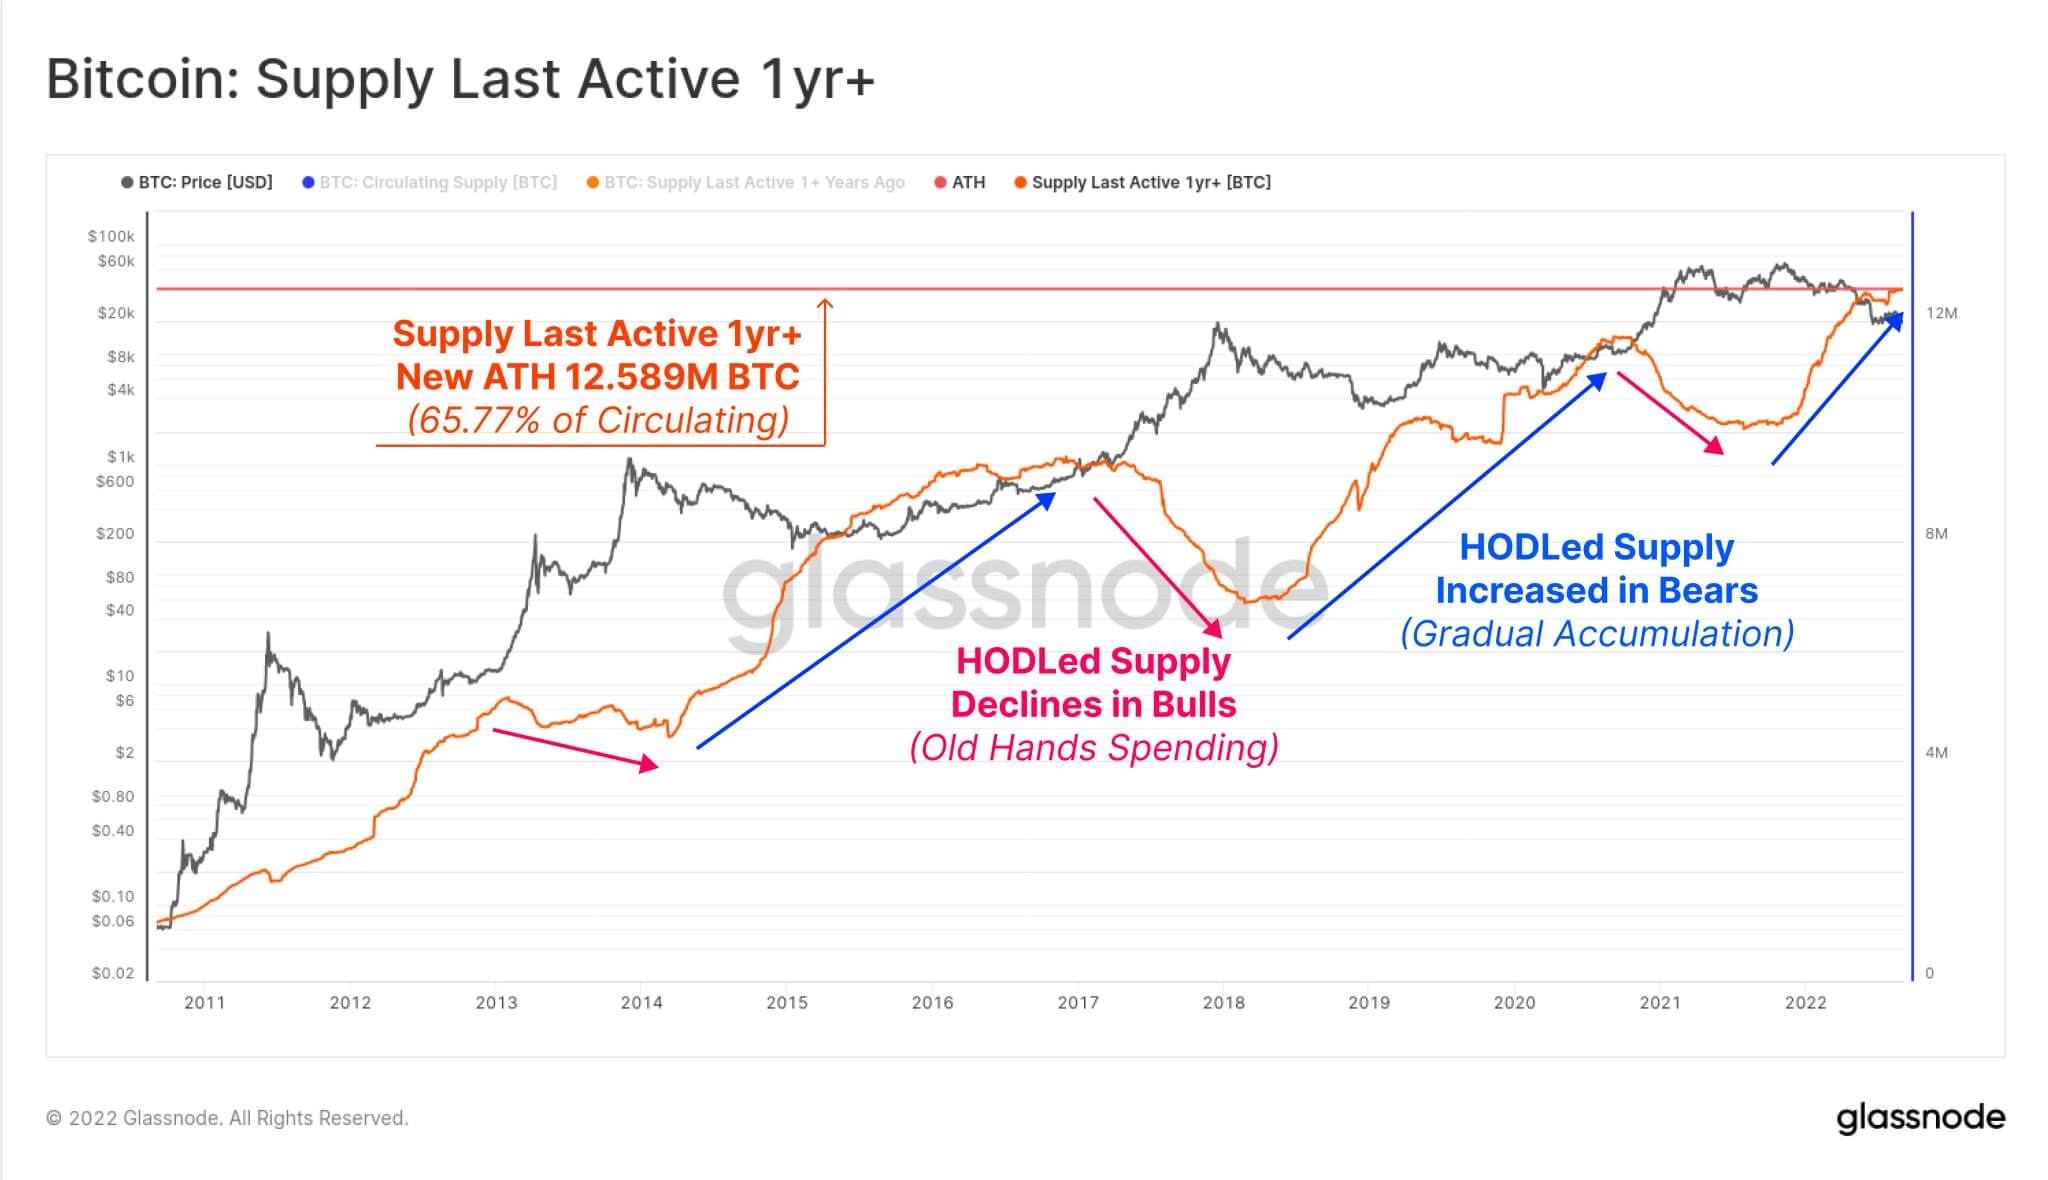
Bitcoin accumulation by investors
Another interesting metric from Glassnode is the volume of investors’ relative unrealised losses. It shows how much coins lost in value when they were sold above their current value. A rise in the indicator suggests that cryptocurrency wallets continue to hold onto their coins despite their relative depreciation, and do not sell them at a loss.
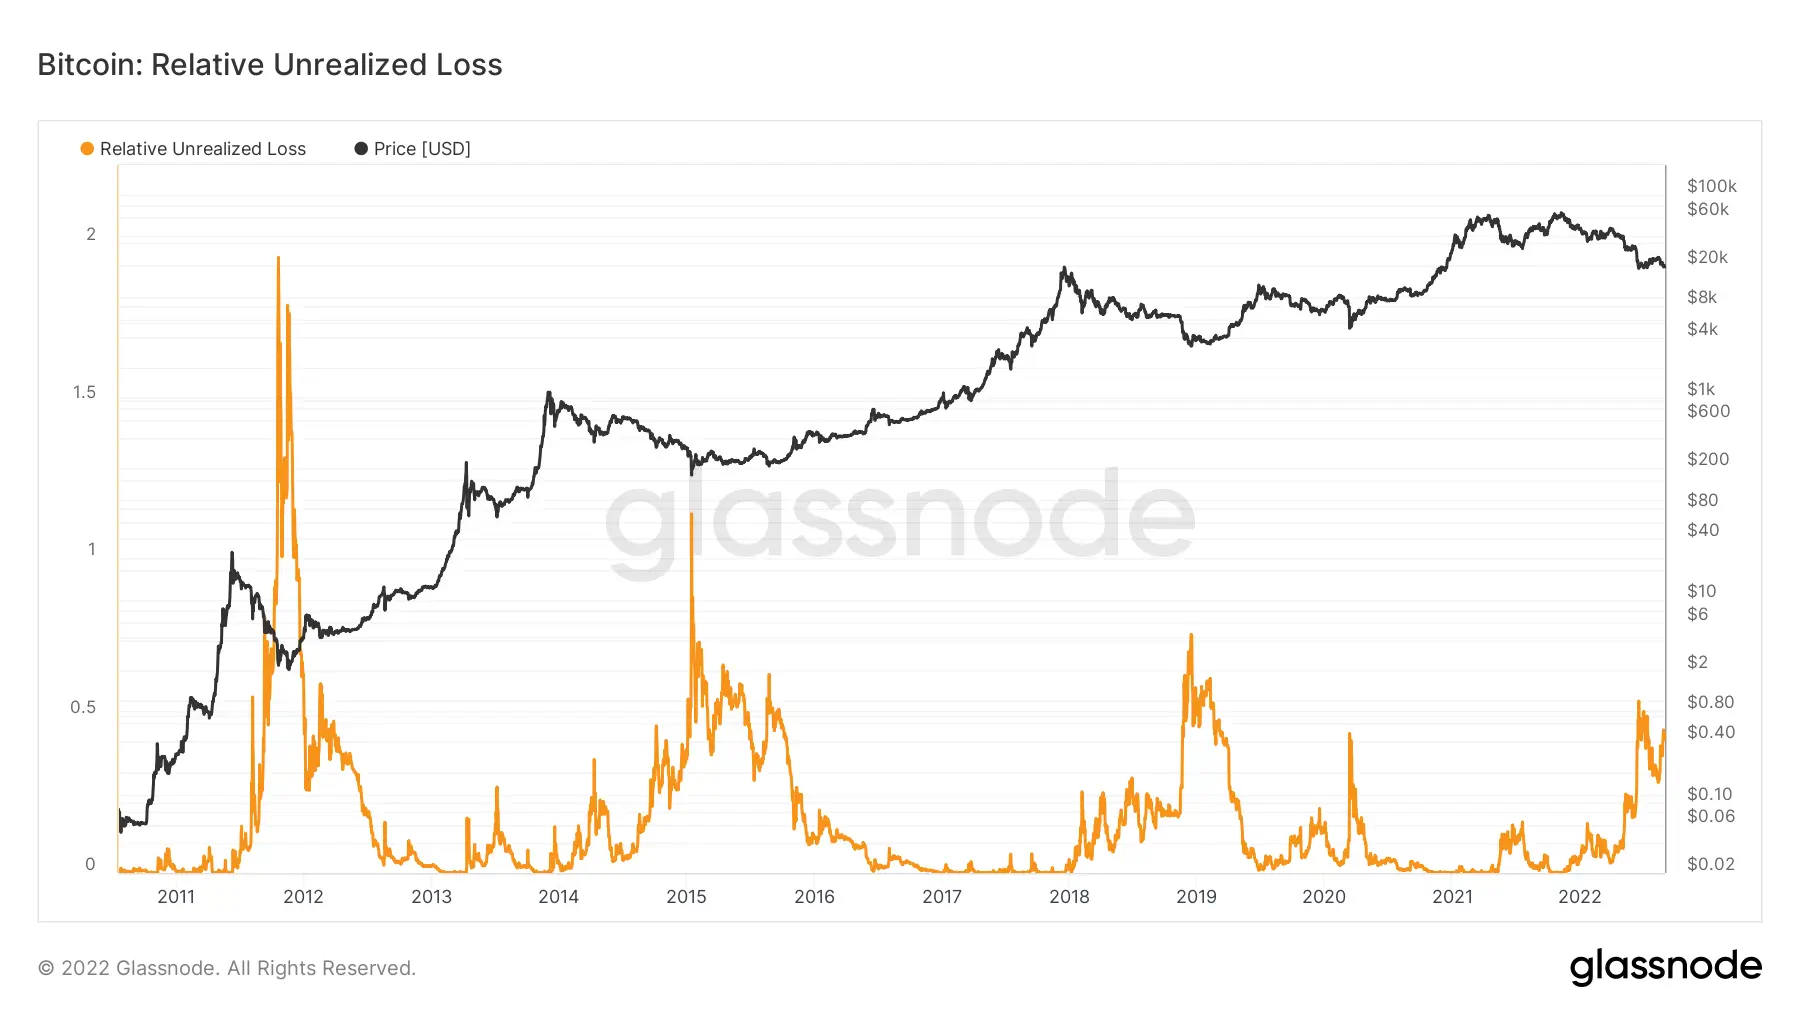
Volume of investors’ unrealised losses
As you can see from the chart above, the global highs of the indicator coincided with the lows of the Bitcoin price. That is another argument for the formation of a bottom around the BTC price of $20K.
🤩 READ MORE INTERESTING THINGS ABOUT CRYPTO ON OUR YANDEX.ZEN!
The counterbalance to the day theory for Bitcoin so far is historical data on the cryptocurrency’s profitability in September. The fact is that this month is considered the worst profitability for BTC since 2013. Only in 2013 and 2021 was September positive in terms of profitability for investors.
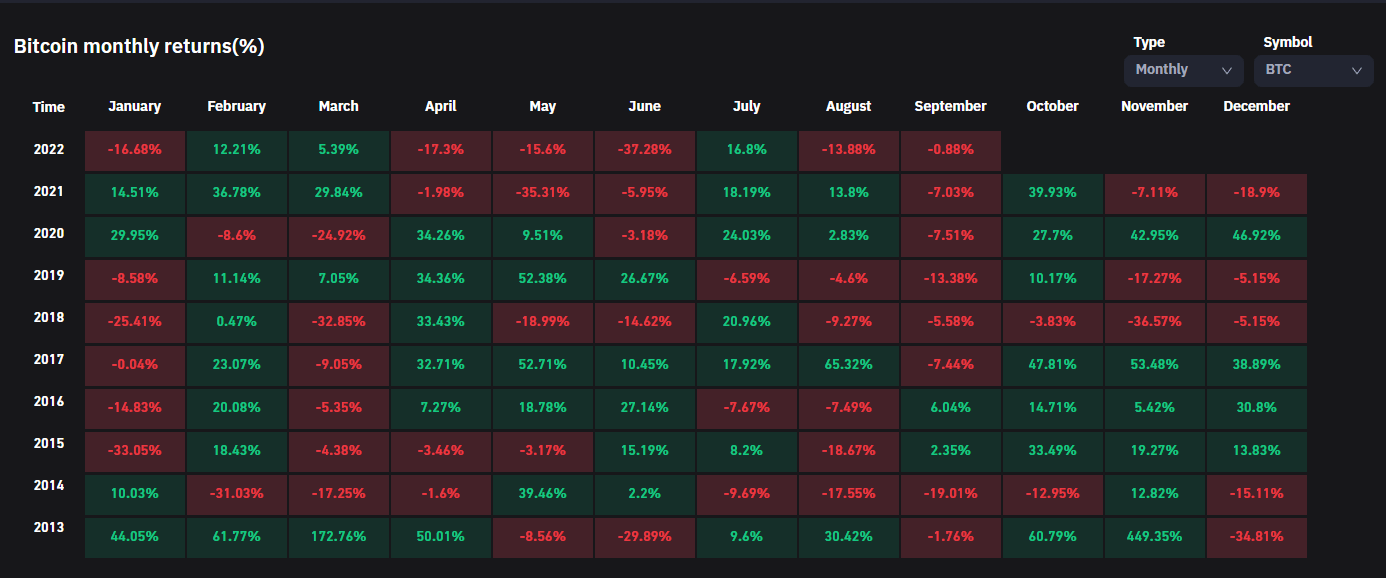
Bitcoin returns by month. For the current September, returns from the beginning of the month are shown
"The September effect applies even to traditional markets. For example, for the popular S&P 500 stock index, this is the worst month since 1928. Throughout that time, September has been giving investors in the index an average loss of 1.1 per cent.
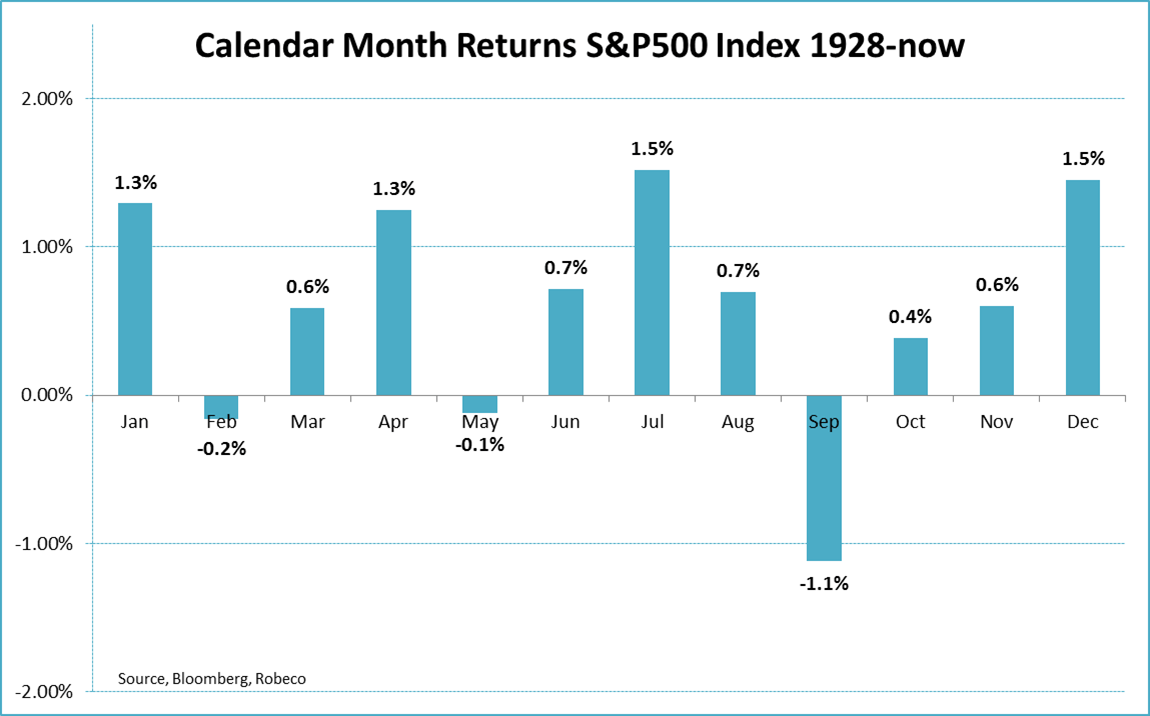
Average return of S&P 500 by month
This trend is explained by a massive fixation of investor positions as the end of the year for tax reporting draws near. History does not necessarily repeat itself, but it can often go in the same circle – there is a high probability of a new wave of BTC price plummet this month, judging only by historical data.
It is important to understand that what has happened to the cryptocurrency in the past does not guarantee a repeat of the situation in the future, so this analysts' version could well fail. However, at the same time, it is worth keeping in mind that investors are shaping the market, and novice players are behaving in much the same way. Hence, there is a similarity in the movements of asset prices. Therefore, the investor's assumption should be treated as one of the possible market scenarios.
Follow the market developments in our millionaires’ cryptochat. There we discuss other important developments for the digital asset industry.
Related posts