
Low volatility and risk of collapse: what do experts expect from the Bitcoin price this week?
The new week for Bitcoin starts with the same thing that has been dominating the market for more than a month now – a lack of serious volatility, i.e. sharp changes in cryptocurrency values. The main cryptocurrency is still wedged within price frames between the $19,000 and $20,000 levels, with the macro situation remaining flat with a hint of deterioration. However, Bitcoin is predicted to see a significant price hike. Which way is the cryptocurrency expected to move, and what could happen to it this week? We tell you in more detail.
This morning, the situation with the rates of the most popular cryptocurrencies looks like this.
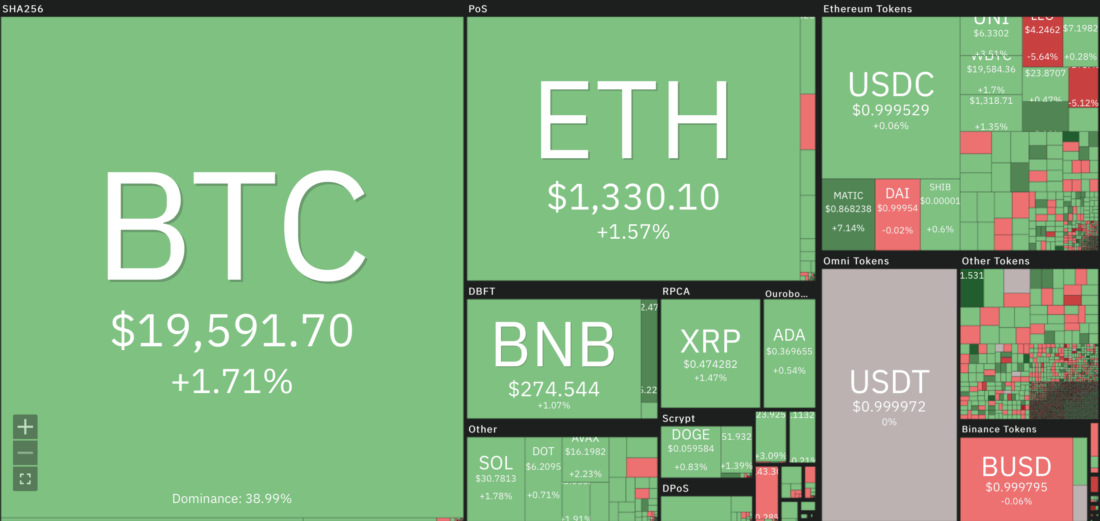
Changes in cryptocurrency exchange rates over the past 24 hours
That is, many large coins by market capitalization gave an increase in the rate by 1-2 percent. Accordingly, the situation continues to be relatively stable, although BTC itself is still below $20,000.
What will happen to the Bitcoin exchange rate
The ratio of the expected volatility of the S&P 500 stock index (VIX) to the Bitcoin volatility index (BVOL) has almost reached its all-time high. This means that the rate of change of the cryptocurrency’s price is now more similar to that of stocks. As you can see in the chart, this has not happened often before.
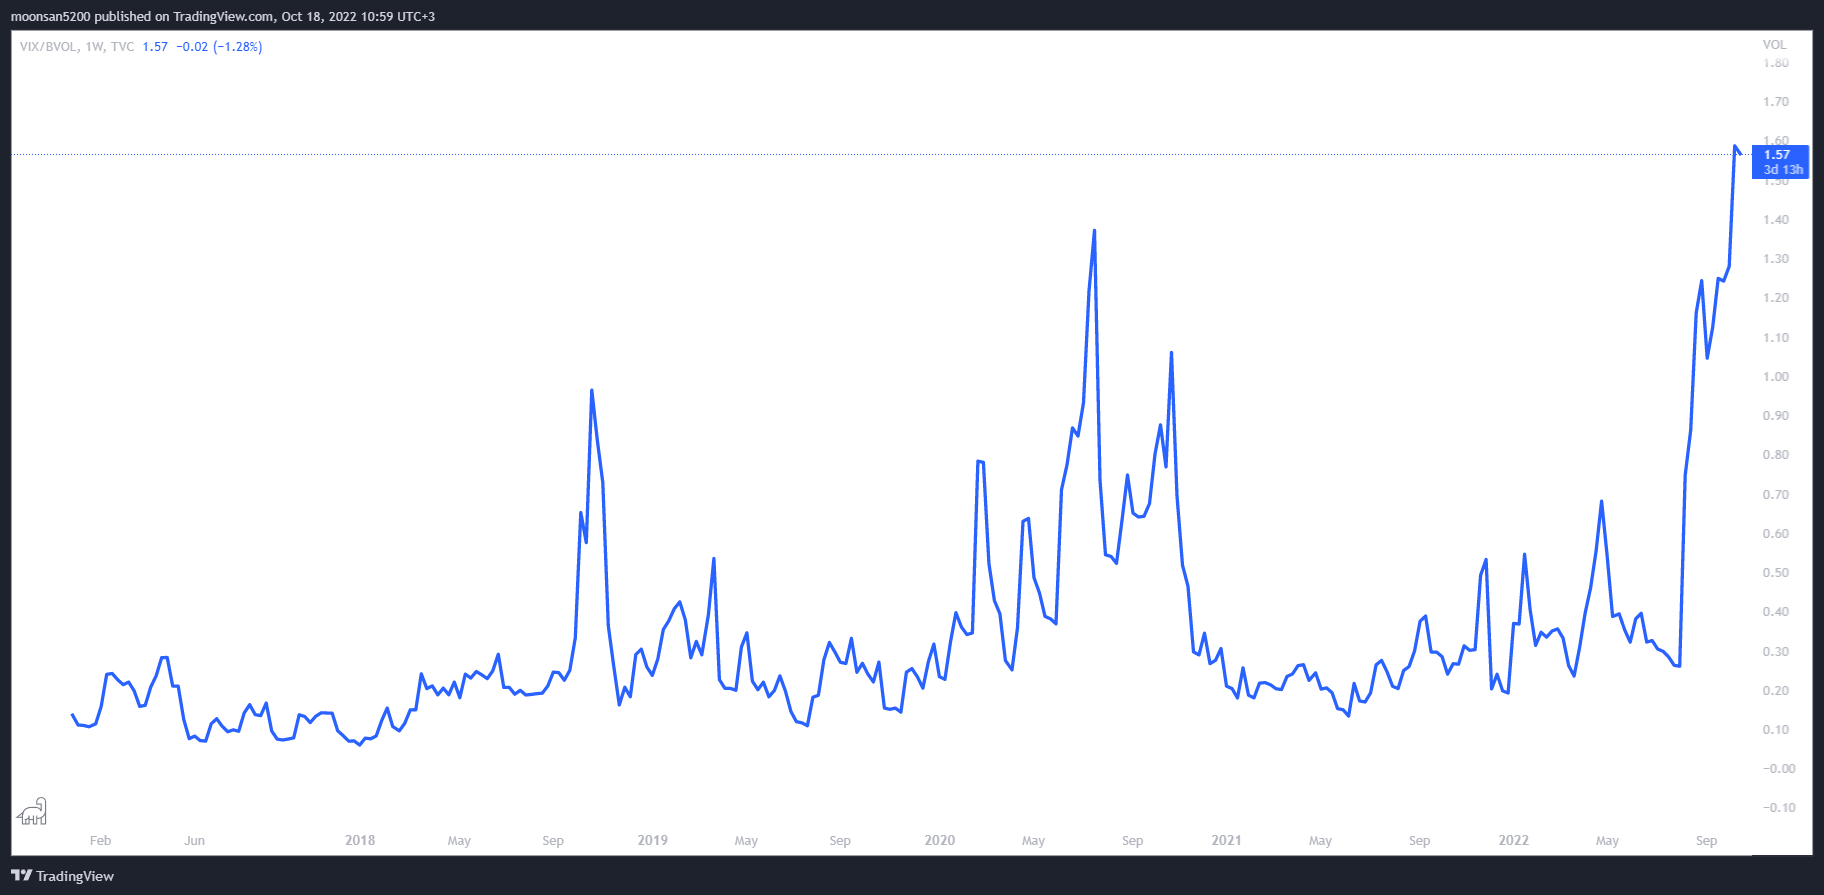
VIX to BVOL ratio
According to Cointelegraph’s sources, the rise in the aforementioned ratio has almost always ended in a precipitous fall. That is, periods of low volatility are followed by an asset price spike. This is also confirmed by analysts at Twitter platform Delphi Research. Here’s their rejoinder.
The Bitcoin Volatility Index (BVOL) has recently reached extreme lows. When BVOL falls below 25 points, it indicates a possible surge in volatility is imminent.
That is, experts are making it clear that the exchange rate of a popular crypto-asset cannot remain virtually stationary for a long period of time. Sooner or later, it will end, with protracted periods of slack usually resulting in notable changes.
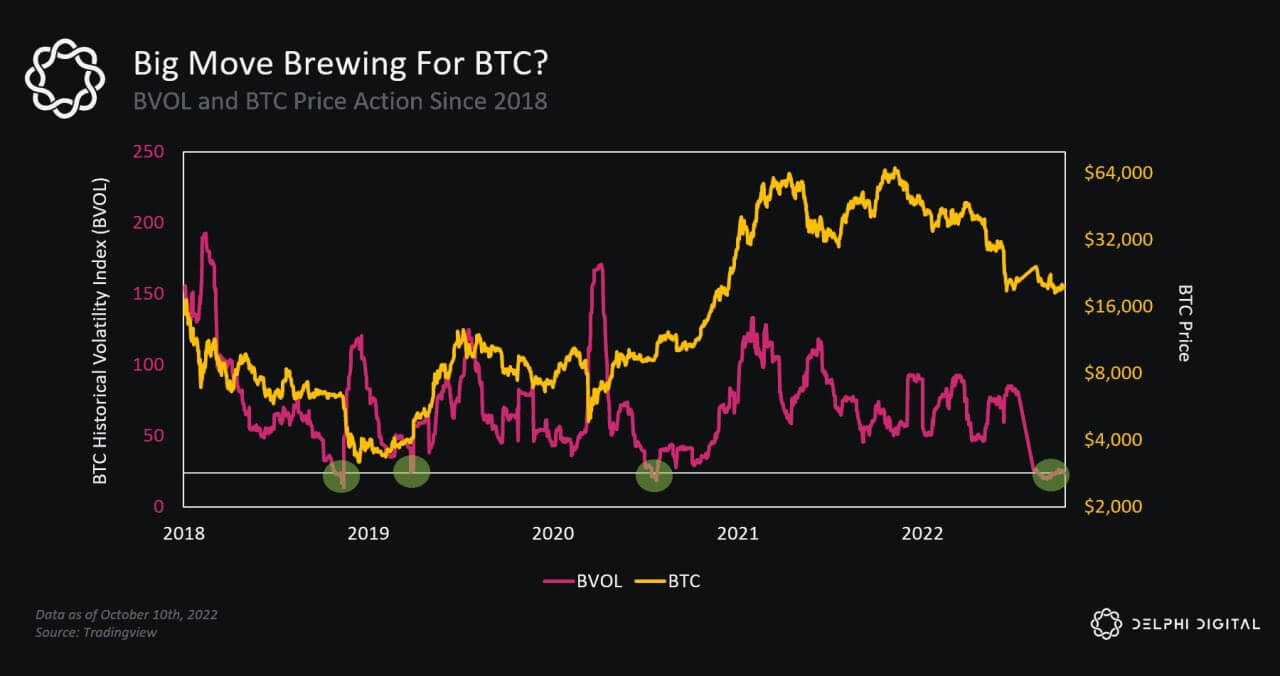
Bitcoin’s falling volatility
A popular crypto analyst nicknamed Il Capo of Crypto predicts a short-term rise in BTC to the $21,000 line, after which the coin will go looking for a new bottom around $14,000 to $16,000. He commented on his prediction with the following quote.
Some shiatcoins will be plummeting these days while Bitcoin rises to $21,000. This may mislead you into thinking a bullish trend has begun again. My advice: don’t get greedy. Take profits at the first opportunity. Protect your capital.
Traditionally, this is just one of the possible outcomes, which may not come true. However, this analyst does not see the future and only makes assumptions, in addition, he has been wrong many times before. Therefore, his words should be taken with caution, and investment decisions should always be made on your own.
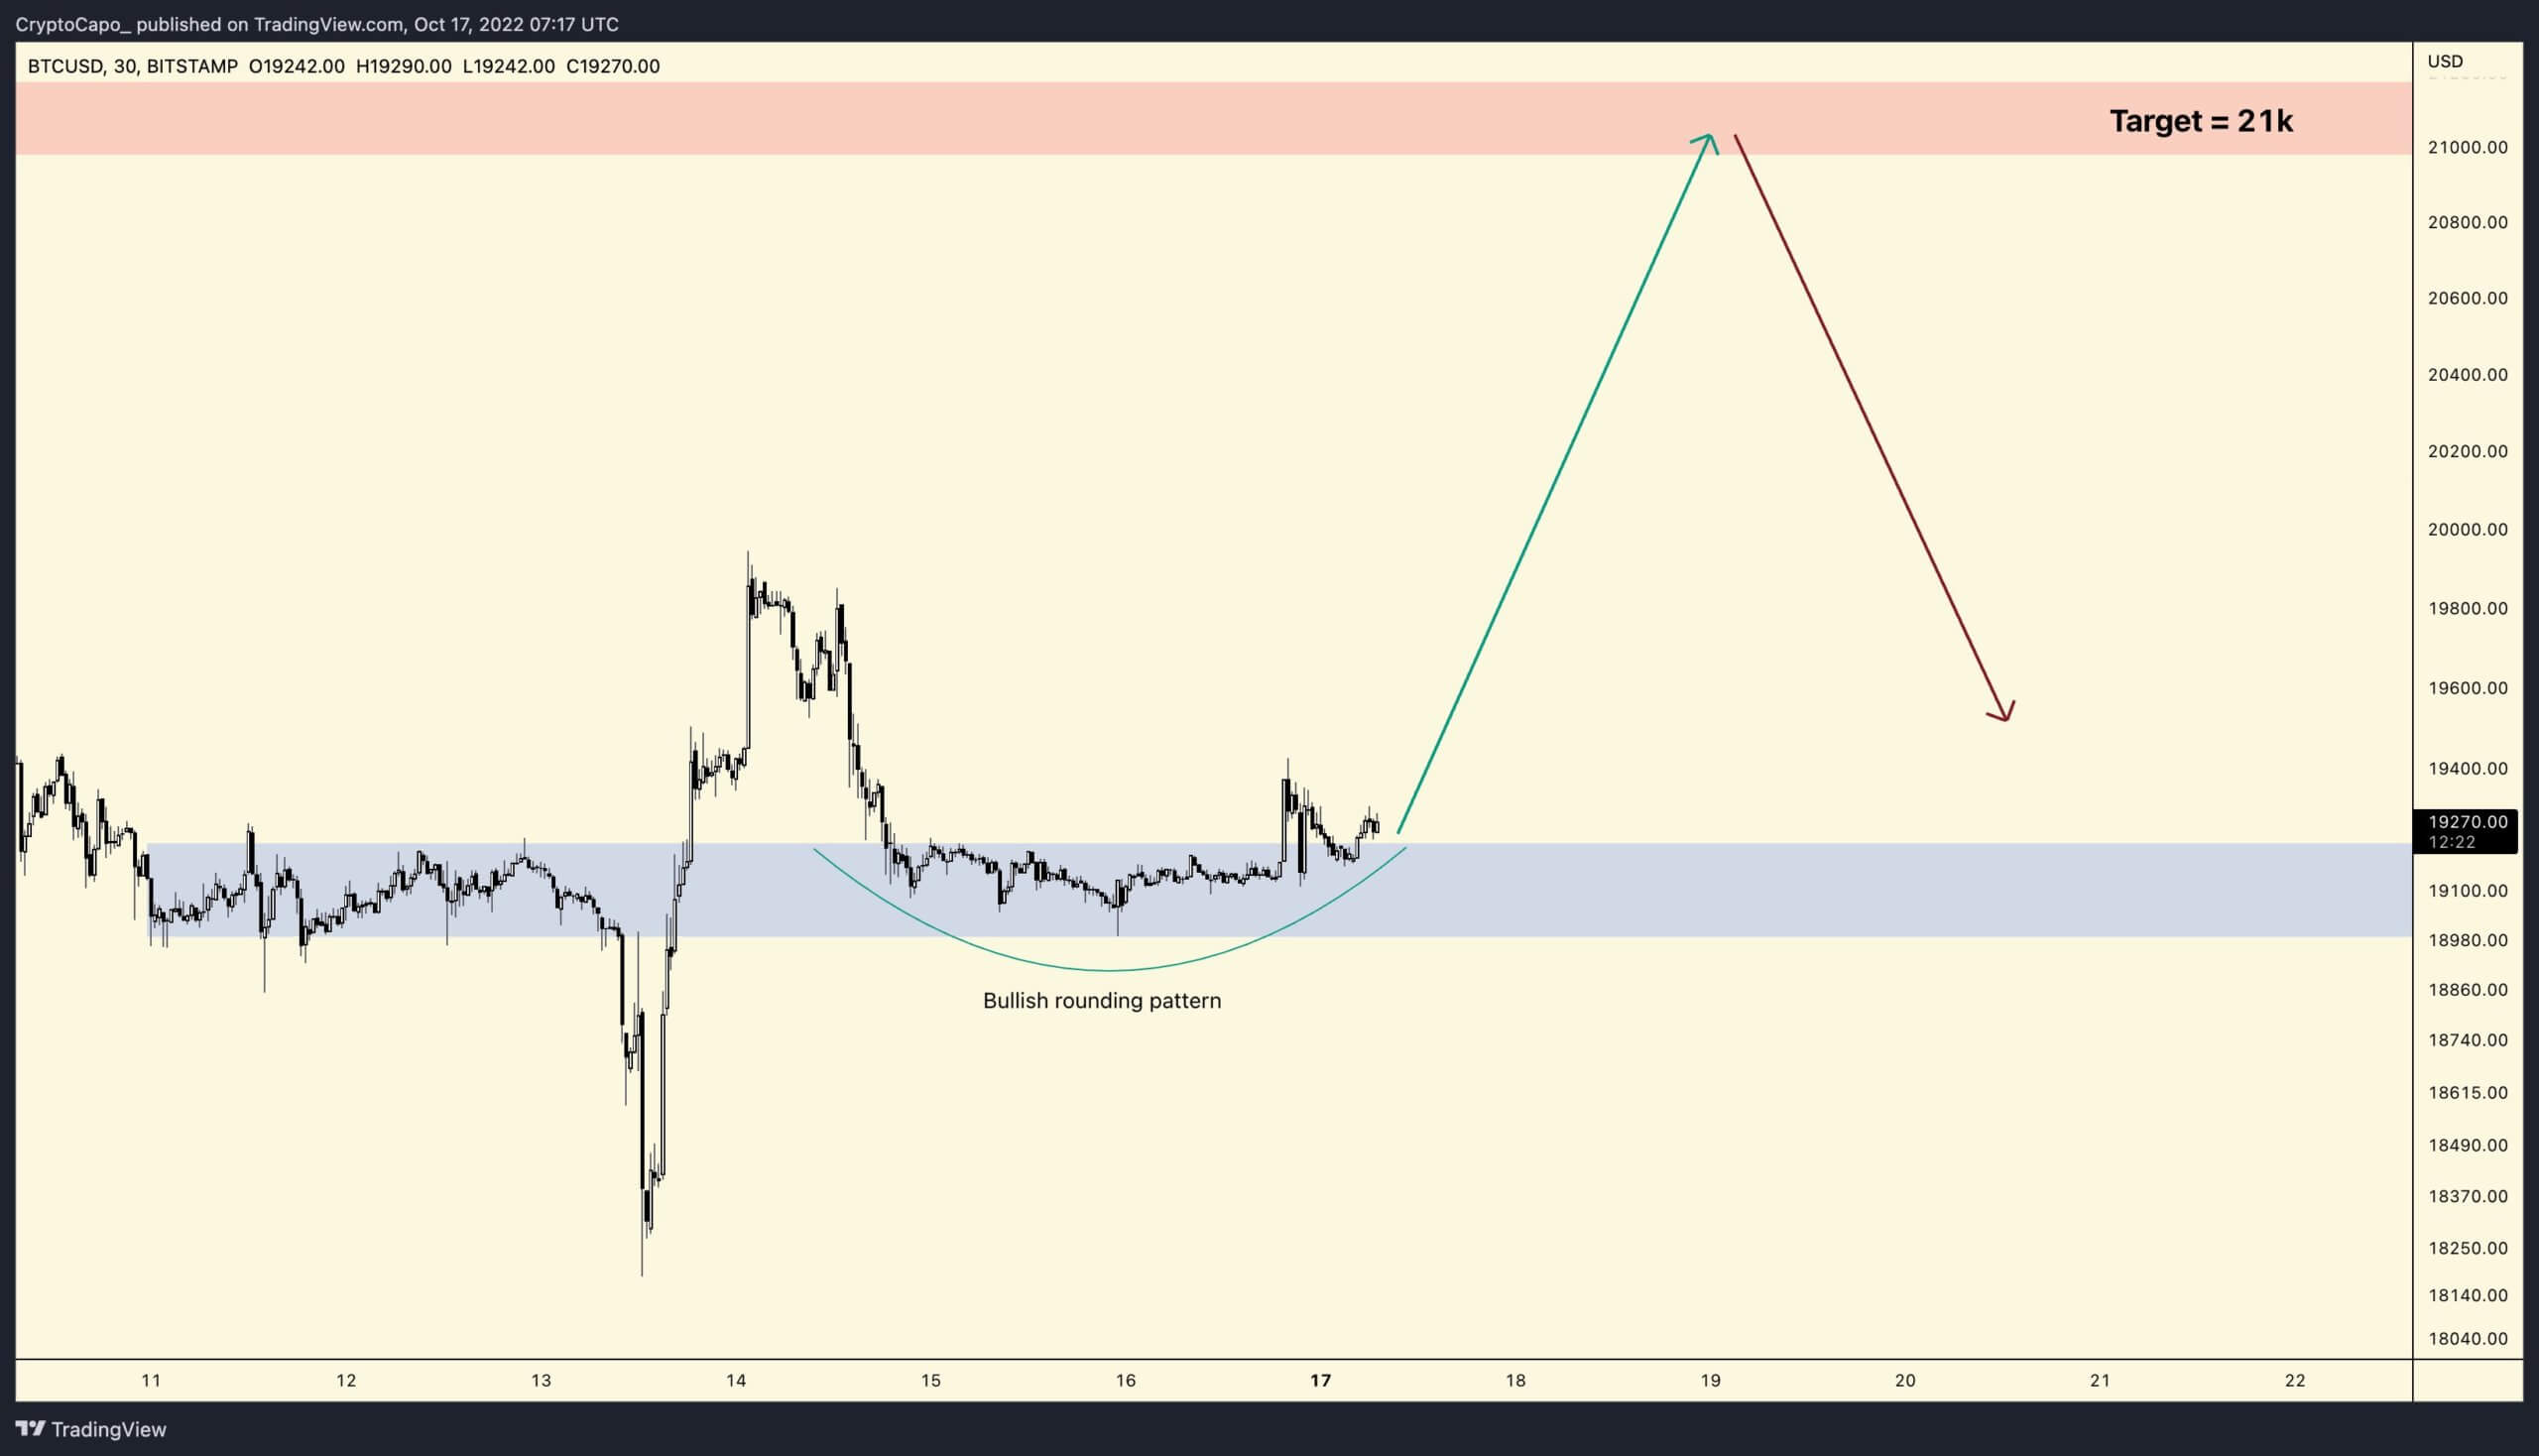
Il Capo of Crypto forecast
What’s happening in the macro economy
Corporate reporting season in the US kicks off for the big companies – some of them will release their financial results this week. Their total capitalisation represents around 20 per cent of the S&P 500 index, which has so far shown no discernible bull market presence.
Experts at finance portal The Kobeissi Letter have shared a disappointing prediction: given the historical data of the US stock market, it could continue to fall for at least a few more months. Here’s a quote from the expert.
Since 1929, the average market has fallen during a recessionary bearish trend of 39 per cent. In addition, it has a duration of 16 months. At present, only 10 months have passed since the start of the bearish trend in equities, and the S&P 500 is down just 28 per cent. All indications are that there is an even bigger collapse ahead.
Again, a development in the past does not guarantee it will happen again in the future. So expecting a direct breakdown of 39% should also be cautious, because it may not happen.
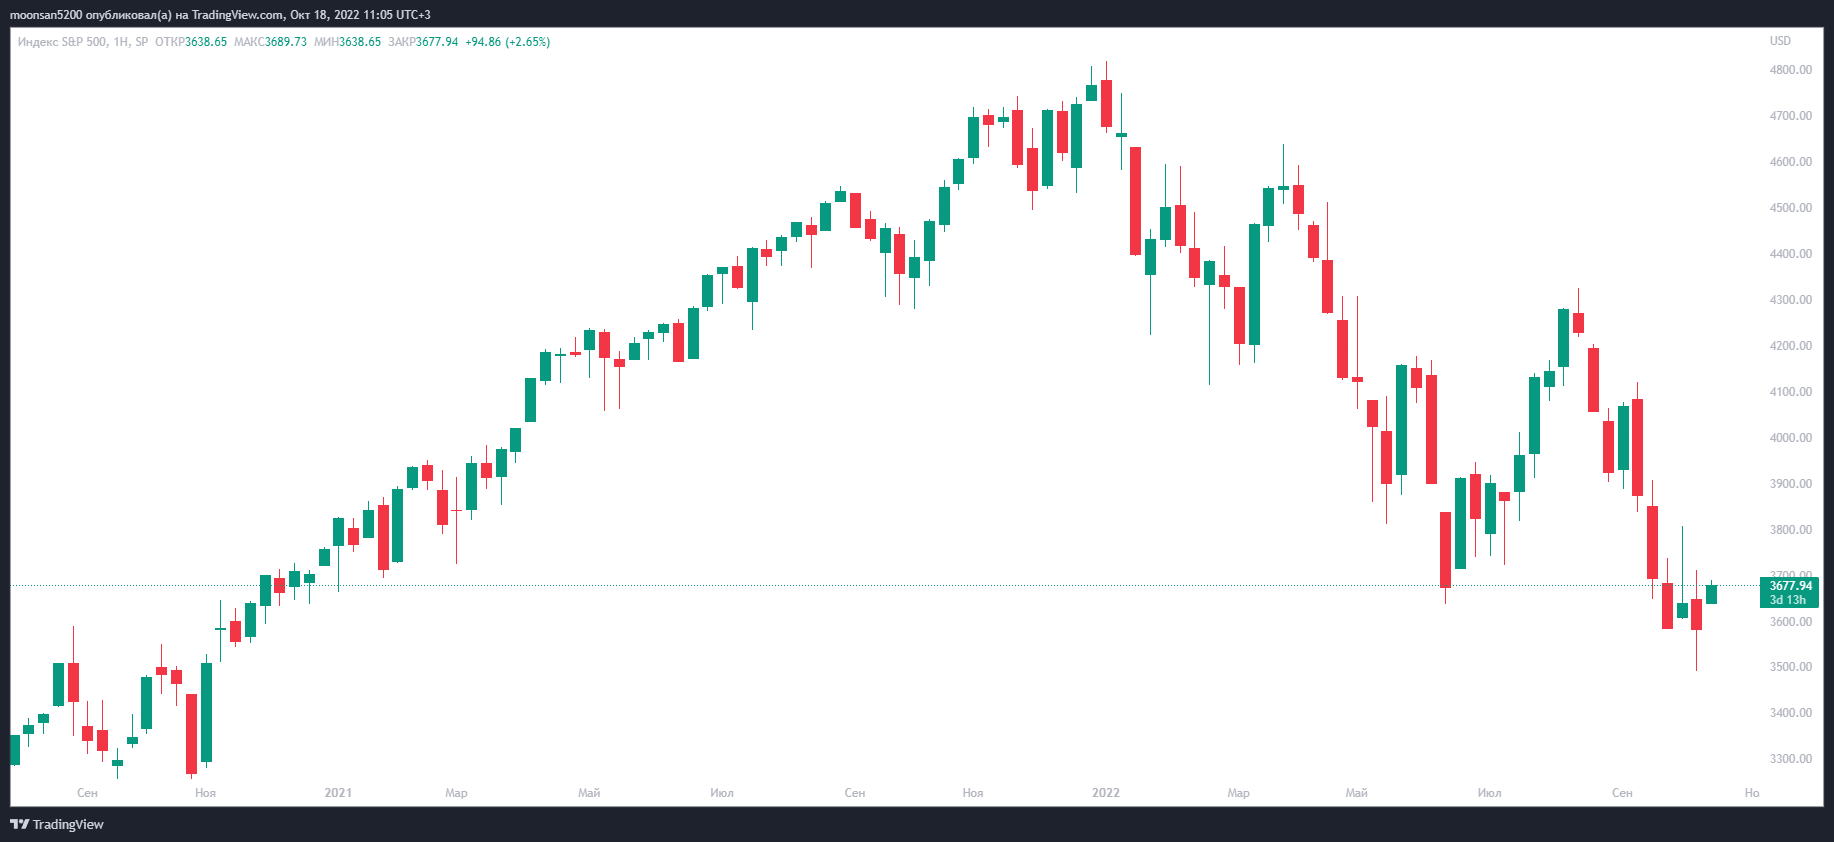
The fall of the S&P 500
Despite talk about the uniqueness and independence of the first cryptocurrency, it still correlates with traditional markets. According to experts, while the S&P 500 is falling, hopes for even local growth in BTC are far from reality. And there are more than enough different factors for the S&P 500 to fall – the constant increase in the US Federal Reserve’s lending rate, high inflation, the energy crisis in Europe and problems in geopolitics.
At the same time, the index has still gained 2.28 per cent in the last five days. And in the past 24 hours it has risen by 2.65 percent.
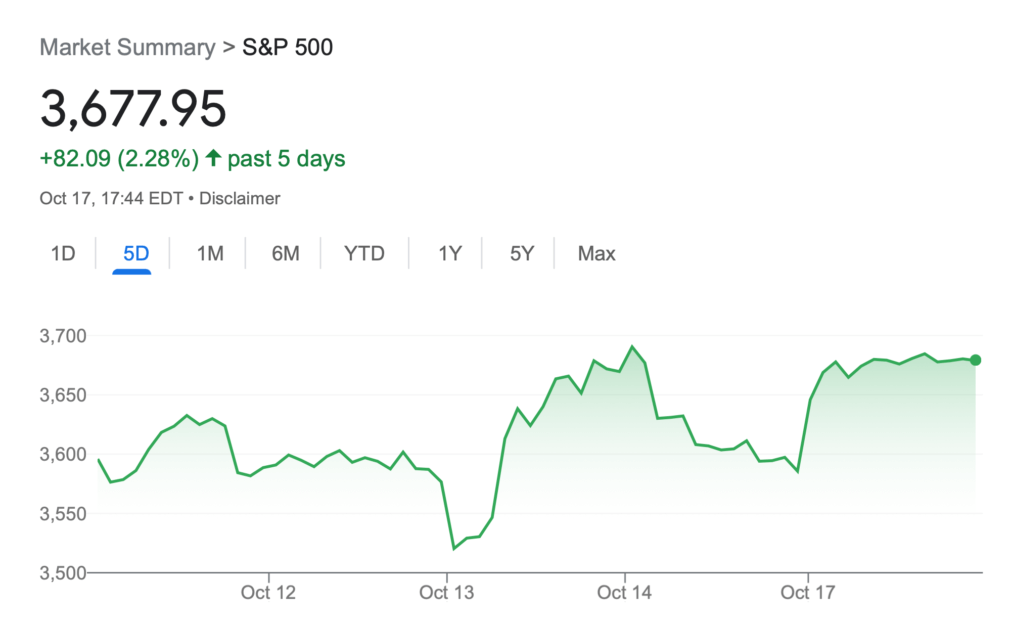
S&P500 index movement in the past five days
How likely is a new Bitcoin collapse?
Back to the Bitcoin chart. Cryptoanalyst Matthew Hyland posted an interesting chart on Twitter, which clearly shows the similarity of BTC’s current price movement to the coin’s trading history in 2018. Bitcoin is now at the last level of support before another collapse, with only a couple of weeks to go according to the forecast.
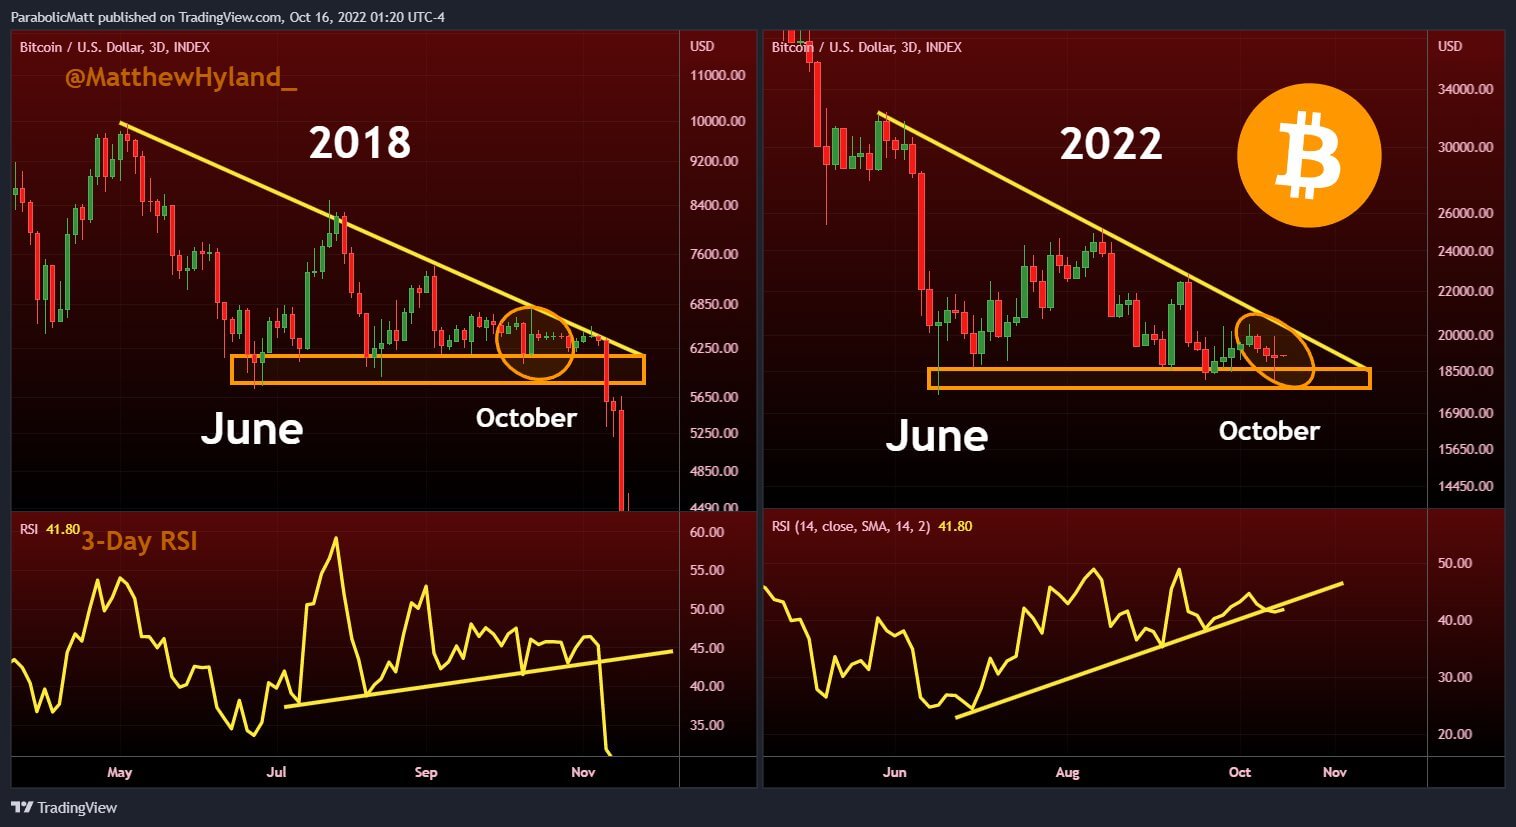
Comparing the current bearish trend to the “cryptozyme” of 2018
Hyland also noted similarities in the 3-day Relative Strength Index (RSI) reading. As a reminder, RSI is a technical analysis indicator that shows the strength of a trend and the likelihood of a trend reversal.
Another chart from the analyst – this time with the Bollinger Bands indicator. They have narrowed considerably in the past few days, which indicates the aforementioned high probability of a new price surge. Hyland expects BTC to collapse, which is also likely if the scenario he published becomes a reality in the market.
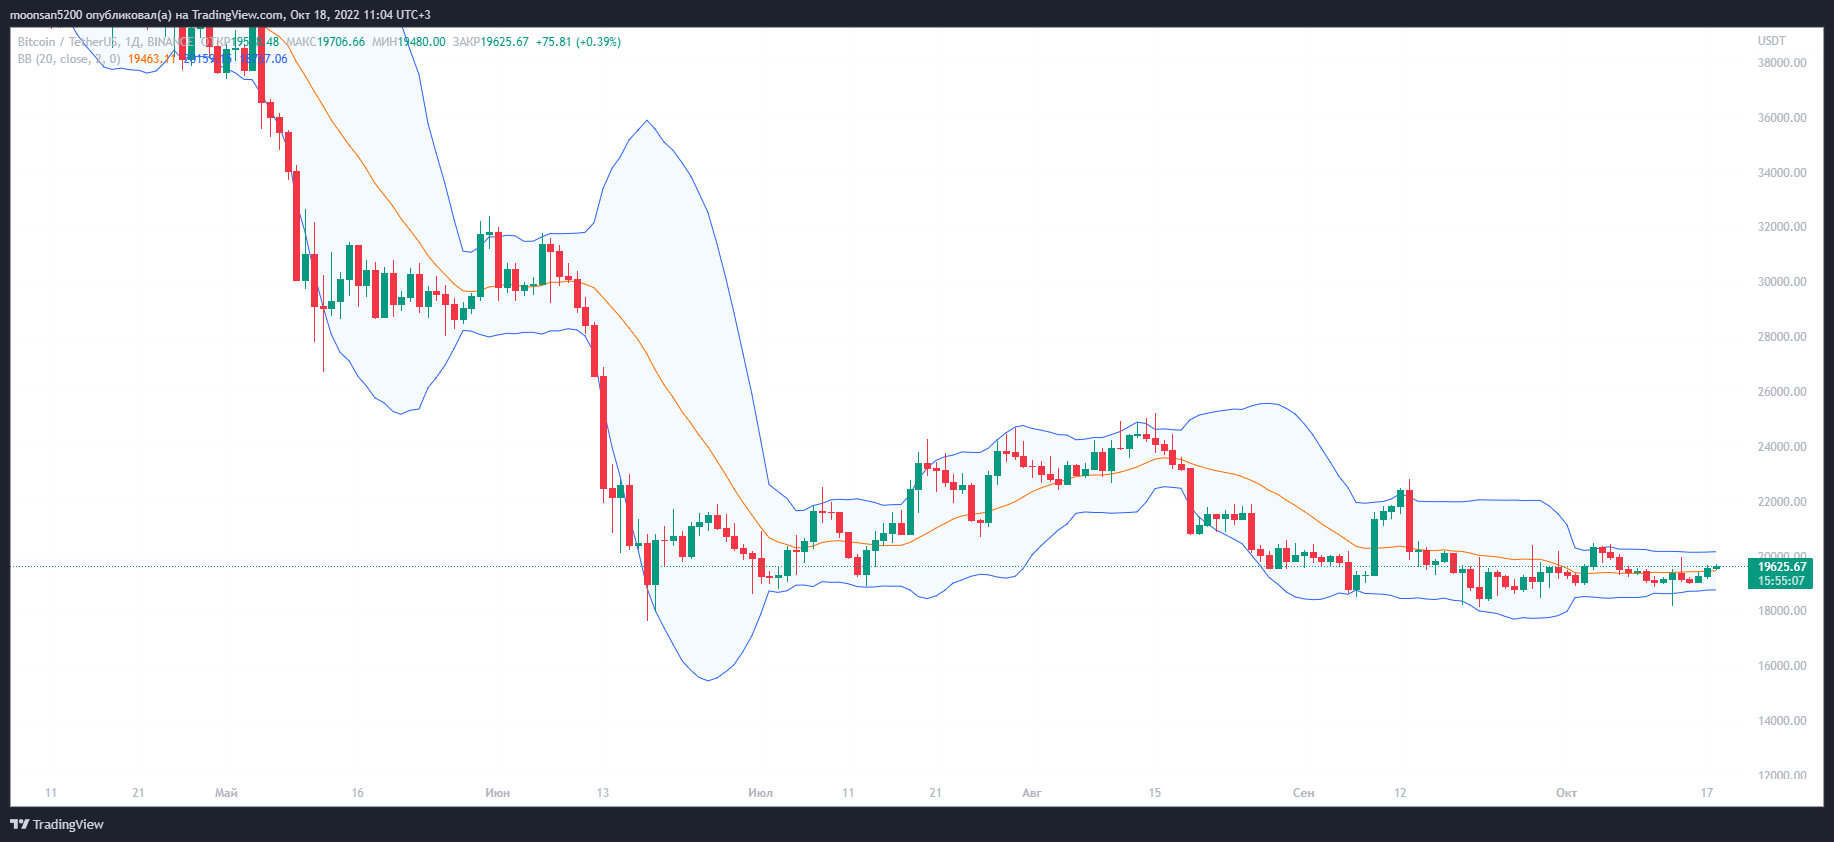
1-day chart of Bitcoin with Bollinger Bands
We believe that today's situation is typical of a bearish trend that has been going on for almost a year now. In this regard, the experts predict new collapses quite predictably, which is quite convenient for today's conditions. However, also here we should not be too negative about the market, because sooner or later the trend will change. Obviously, this will happen after the global inflation problems are solved.
And what predictions do you have? Share them in our Millionaire Crypto Chat. There we will talk about other topics related to the blockchain world.
Related posts